


Top 5 best takeaways from TDWI
At TDWI in Chicago this week, I had the honor to be part of Mark Madsen’s Data Integration Innovation class. He is an incredible speaker and creates presentations with great slides. Each slide is interesting, poignant, and funny. I thought I would share my top five favorite slides and some of my thoughts:
Number 5: I completely fell for the joke at the bottom right. The scenario Mark describes with this image is unfortunately too real. IT projects are carefully prioritized and costed. They are then accomplished in a completely different order. Disruption can come from office politics, team attrition, or a new project suddenly deemed “on-fire”. Business teams resort to e-mailing each other spreadsheets instead of collaborating in a governed way.
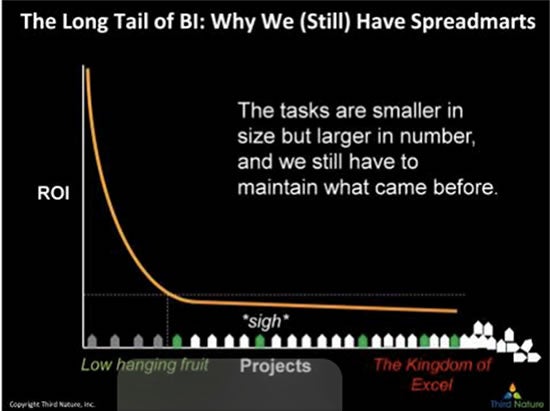
The caption: Spreadmarts are the bane of most BI programs, but they exist for a reason. They represent freedom from the control of the centralized BI group and allow users the ability to access, combine and analyze data without waiting. In short, they get things done. However, they get things done at the cost of distributed and hidden business rules, data quality issues and redundant data. Many in the BI community believe that spreadmarts are the result of civil disobedience, when in reality it’s a result of the challenges of BI programs to deliver.”
- My perspective: The Paxata platform allows business analysts to be self-sufficient. Analysts work with their data in a familiar spreadsheet metaphor, with smart algorithms tackling massive scale. The Paxata platform provides a collaborative environment instead of ungoverned Excel spreadmarts. Everyone can get their projects done without having to fight for priority in line (and the IT team can prune down their long queue of requests).
Number 4: Where does he get these images!!? This slide was a turning point in the presentation, a rallying cry to data integration experts. IT teams are encouraged to get things done faster, but aren’t equipped with solutions to get more done.
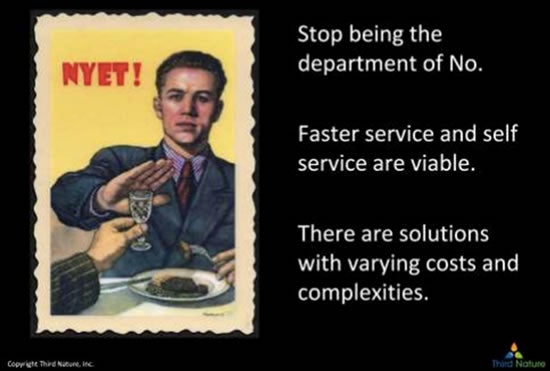
- My perspective: The Paxata platform is architected with Spark as a critical element to enable yes. The Paxata custom optimization with Spark processing billions of rows interactively. To get results quickly, you need to be able to work smart. That’s why Paxata designed an intuitive UI that matches the iterative data prep process. You can get your work done in fewer steps and trust the platform to do the data processing part quickly.
Number 3: Years of living in the Pacific Northwest immediately came to my mind with this picture. Mark described a salmon day: the type of day where you keep swimming but you don’t make any progress. As an analyst, it’s a sinking familiar feeling when you are handed a dataset that you’ve never seen before and you don’t have the first clue of how to make sense of it.
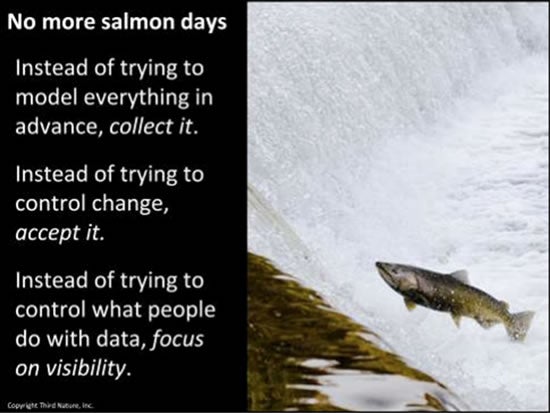
- My perspective: One of our customers described Paxata as a data coach. Paxata’s machine learning and intuitive visual cues guide you to figure out what you’re looking at, what to do, and how to do it quickly. No more salmon days!
Number 2: This image drew huge laughs from the crowd. Mark is advocating that we trust business analysts to get closer to the data. After all, business teams are more familiar with their data and their own requirements for analysis than anyone else.

- My perspective: With Paxata, IT teams can feel confident in the platform’s complete governance, auditability, and enterprise-grade security. Business teams work with the ease of the spreadsheet-like interface and iterate through their preparation process without being encumbered by external governance tools. Everything is built into the Paxata platform seamlessly to maintain consistent metadata, lineage, and permission-based access.
Number 1: I’m going to print this out and frame it.
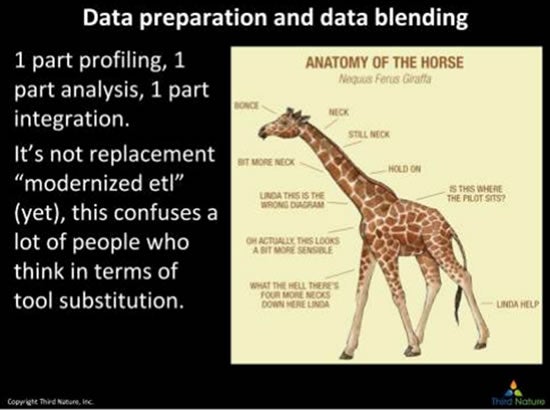
- My perspective: Ever since Paxata introduced self-service data preparation in 2012, the market has jumped on board to declare data preparation at every turn. Mark distinguished the difference between data blending, ETL, and data preparation with this hilarious graphic. You can call yourself anything you want, but that doesn’t make you true data prep. Enterprise-grade data preparation includes data quality, data integration, and master data management. It requires collaboration, governance, and adaptive intuitive user experience.
DataRobot is the leader in Value-Driven AI – a unique and collaborative approach to AI that combines our open AI platform, deep AI expertise and broad use-case implementation to improve how customers run, grow and optimize their business. The DataRobot AI Platform is the only complete AI lifecycle platform that interoperates with your existing investments in data, applications and business processes, and can be deployed on-prem or in any cloud environment. DataRobot and our partners have a decade of world-class AI expertise collaborating with AI teams (data scientists, business and IT), removing common blockers and developing best practices to successfully navigate projects that result in faster time to value, increased revenue and reduced costs. DataRobot customers include 40% of the Fortune 50, 8 of top 10 US banks, 7 of the top 10 pharmaceutical companies, 7 of the top 10 telcos, 5 of top 10 global manufacturers.
-
How to Choose the Right LLM for Your Use Case
April 18, 2024· 7 min read -
Belong @ DataRobot: Celebrating 2024 Women’s History Month with DataRobot AI Legends
March 28, 2024· 6 min read -
Choosing the Right Vector Embedding Model for Your Generative AI Use Case
March 7, 2024· 8 min read
Latest posts
