

An Alternative Approach to Pitch Framing: Part 3
In our previous blogs on pitch framing (Part 1, Part 2), we explored the ability of some machine learning techniques to capture nonlinear behavior and promised that by controlling for more factors (pitcher, umpire, etc.) we could improve our model.
Within DataRobot, we reran our process from the previous blog posts, included handedness and pitch type in the features we used to predict whether or not a pitch would be called a strike, and used an Extreme Gradient Boosted Tree to make the strike prediction.
We can control for these additional factors in a number of ways, which we’ll discuss in this third, and final, installment in this blog series. Baseball Prospectus builds models for each combination of pitcher and batter handedness and types of pitches. However, we do not need to do this as the techniques we can simply include this information as features in our Extreme Gradient Boosted Tree and let the algorithm learn how to use this information.
Letting the algorithm learn
Within DataRobot, we reran our process from the previous blog posts, included handedness and pitch type in the features we used to predict whether or not a pitch would be called a strike, and used an Extreme Gradient Boosted Tree to make the strike prediction.
This gives rise to a slight improvement in AUC to .9803 along with a very good ROC curve (see Figure 1):
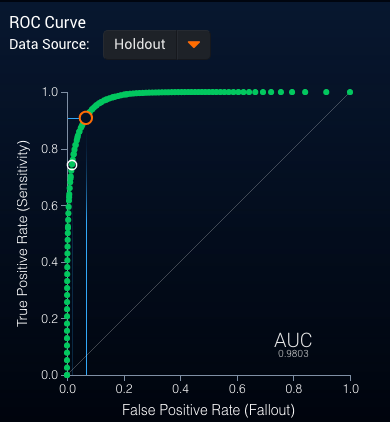
Figure 1: ROC Curve for Extreme Gradient Boosted Tree
This model also gave a similarly strong separation between pitches called strikes and balls (see Figure 2):
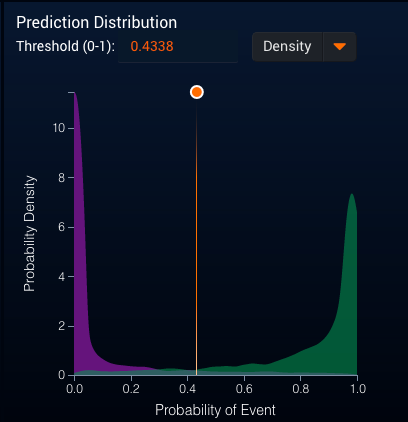
Figure 2: Strike Probability Distribution
Next, we follow the same procedure as in the last blog post: score the 2017 pitches, classify the pitch as a strike (if the probability is above 0.5) or a ball (if the probability is below 0.5) in order to get the top 10 catchers (by pitches framed and runs saved) who saw at least 1000 called pitches:
|
Catcher |
Extra Strikes |
Run Value from Extra Strikes |
|
Austin Hedges |
202.853671 |
26.9795382 |
|
Tyler Flowers |
202.080192 |
26.8766656 |
|
Martin Maldonado |
168.828049 |
22.4541305 |
|
Yasmani Grandal |
168.811989 |
22.4519945 |
|
Christian Vazquez |
160.833808 |
21.3908965 |
|
Roberto Perez |
113.906301 |
15.1495381 |
|
Yadier Molina |
102.08369 |
13.5771308 |
|
Austin Barnes |
101.803703 |
13.5398924 |
|
Stephen Vogt |
72.6301713 |
9.65981278 |
|
Sandy Leon |
69.9584404 |
9.30447258 |
And the bottom 10 Catchers:
|
Catcher |
Extra Strikes |
Run Value from Extra Strikes |
|
Willson Contreras |
-145.95023 |
-19.41138 |
|
Jonathan Lucroy |
-143.51868 |
-19.087985 |
|
Matt Wieters |
-117.29618 |
-15.600392 |
|
Alex Avila |
-109.08037 |
-14.50769 |
|
Salvador Perez |
-107.15433 |
-14.251526 |
|
Tucker Barnhart |
-95.780162 |
-12.738762 |
|
Omar Narvaez |
-90.118736 |
-11.985792 |
|
James McCann |
-90.104138 |
-11.98385 |
|
Cameron Rupp |
-83.337049 |
-11.083827 |
|
Luis Torrens |
-83.161358 |
-11.060461 |
Similarly, using the probability that a pitch is a strike to generate the expected number of strikes, we get the following top 10 catchers:
|
Catcher |
Extra Strikes |
Run Value from Extra Strikes |
|
Tyler Flowers |
228.141103 |
30.3427667 |
|
Martin Maldonado |
212.512971 |
28.2642252 |
|
Christian Vazquez |
205.929343 |
27.3886026 |
|
Yasmani Grandal |
187.594148 |
24.9500217 |
|
Austin Hedges |
186.138925 |
24.756477 |
|
Roberto Perez |
116.648229 |
15.5142145 |
|
Austin Barnes |
92.1854322 |
12.2606625 |
|
Yadier Molina |
88.3739453 |
11.7537347 |
|
Brian McCann |
76.613271 |
10.189565 |
|
Caleb Joseph |
75.3754694 |
10.0249374 |
And the bottom 10 catchers:
|
Catcher |
Extra Strikes |
Run Value from Extra Strikes |
|
Willson Contreras |
-158.33051 |
-21.057958 |
|
Jonathan Lucroy |
-153.97891 |
-20.479195 |
|
Matt Wieters |
-141.41267 |
-18.807885 |
|
Salvador Perez |
-126.89834 |
-16.87748 |
|
Alex Avila |
-110.81223 |
-14.738026 |
|
Cameron Rupp |
-109.39365 |
-14.549356 |
|
Tucker Barnhart |
-107.73966 |
-14.329375 |
|
James McCann |
-101.99381 |
-13.565176 |
|
Luis Torrens |
-89.537368 |
-11.90847 |
|
Carlos Ruiz |
-85.840281 |
-11.416757 |
While we see minor shuffling of the catchers, the same catchers appear as we saw in the last blog post.
How to build on the same data
One concern with this approach is that we have been building our strike prediction models on 2016 (from PITCHf/x data) and then making predictions on 2017 data (from Statcast). There have been some concerns about the difference between the data from these two systems (see FiveThirtyEight piece). What if we want to evaluate the impact of the catcher on the strike call on the same data? We can do this by rebuilding our model by including the catcher as one of the features, allowing the model to directly determine the impact of catcher on the strike call. Then, using partial dependence discussed in the last post, directly measure the impact of the catcher on the probability of strike call (see Figure 3):
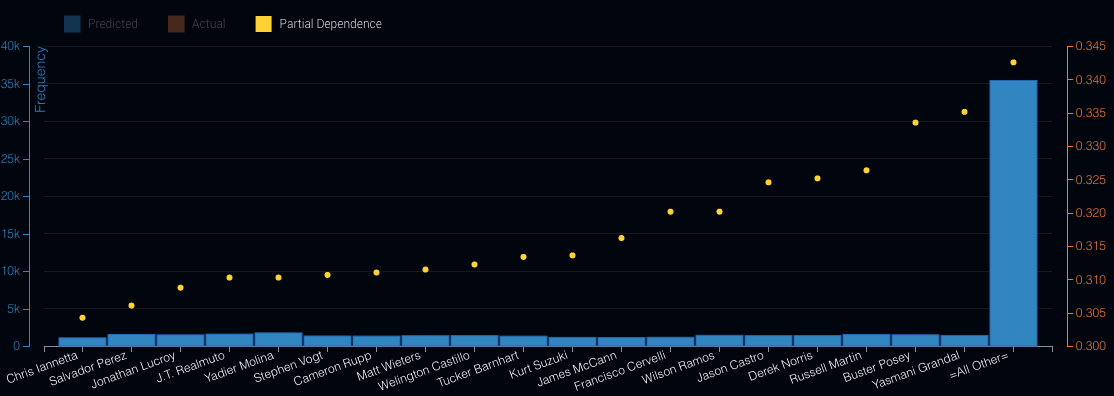
Figure 3: Partial Dependence Plot of Catcher Name
Note that this plot is taken directly from DataRobot and is based on a sample of total data from 2016. We do see some significant differences between this list and the previous lists. Yasmani Grandal still performs well, but James McCann has moved from the bottom 10 towards the middle of the pack.
With this data and DataRobot, there are many additional questions that we can answer about pitchers, catchers, and their impact on the game.
In this series of three blog posts, we have explored DataRobot’s ability to use automated machine learning to understand the impact of the catcher on the strike call. We saw the improvement when we used modeling techniques that automatically accounted for nonlinear behavior and how we could also consider additional factors that might influence the call within a single model. Finally, we explored the ability to understand the catcher’s impact directly from the models without needing to make predictions on new data.
This is only the beginning. With this data and DataRobot, there are many additional questions that we can answer about pitchers, catchers, and their impact on the game.
About the Author
Andrew Engel is a Customer Facing Data Scientist at DataRobot. He works with DataRobot customers in a wide variety of industries, including several Major League Baseball teams. He has been working as a data scientist and leading teams of data scientists for over 10 years in a wide variety of domains from fraud prediction to marketing analytics. Andrew received his PhD in Systems and Industrial Engineering with a focus on optimization and stochastic modeling. He has worked for Towson University, SAS Institute, the US Navy, Websense (now ForcePoint), Stics, and HP before joining DataRobot in February of 2016.

Andrew Engel is General Manager for Sports and Gaming at DataRobot. He works with DataRobot customers across sports and casinos, including several Major League Baseball, National Basketball League and National Hockey League teams. He has been working as a data scientist and leading teams of data scientists for over ten years in a wide variety of domains from fraud prediction to marketing analytics. Andrew received his Ph.D. in Systems and Industrial Engineering with a focus on optimization and stochastic modeling. He has worked for Towson University, SAS Institute, the US Navy, Websense (now ForcePoint), Stics, and HP before joining DataRobot in February of 2016.
-
How to Choose the Right LLM for Your Use Case
April 18, 2024· 7 min read -
Belong @ DataRobot: Celebrating 2024 Women’s History Month with DataRobot AI Legends
March 28, 2024· 6 min read -
Choosing the Right Vector Embedding Model for Your Generative AI Use Case
March 7, 2024· 8 min read
Latest posts
