

Catcher Pitch Framing using Machine Learning: Part Two
In our last blog on this subject, we built a machine learning model to predict whether or not a pitch will be called a strike, and used it to evaluate the ability of major league catchers to frame the pitches. In closing, we mentioned that there was a problem with using the logistic regression approach for this model.
The problem is that the relationships between several of the independent variables (in particular, where the pitch crosses home plate, both vertically and horizontally) have a nonlinear relationship with the target. We can clearly see this if we plot the actual probability a pitch will be called a strike (the orange line in Figure 1) versus its horizontal location in the strike zone. Then, compare it to the partial dependence (which shows the dependence in the model between the target —strike or not), and where the pitch crosses the strike zone.
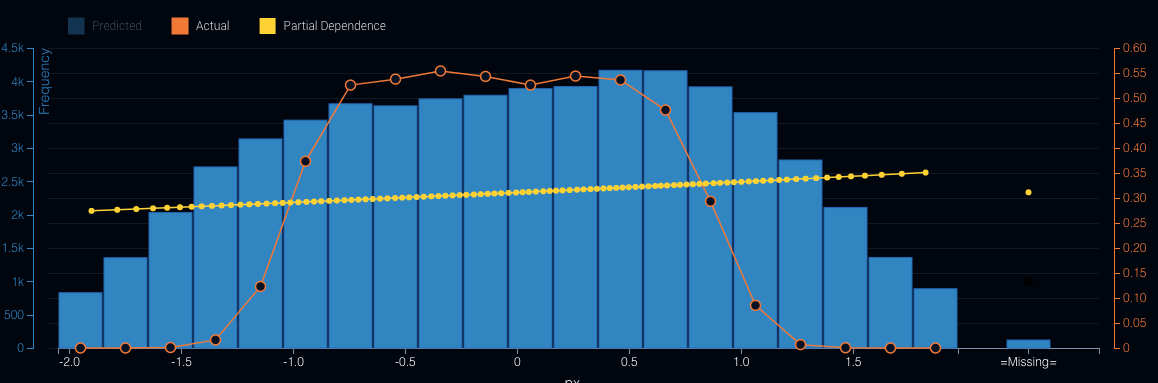 Figure 1: Horizontal Pitch Location
Similarly, we can also see this for the vertical location of the pitch as it crosses the strike zone (see Figure 2).
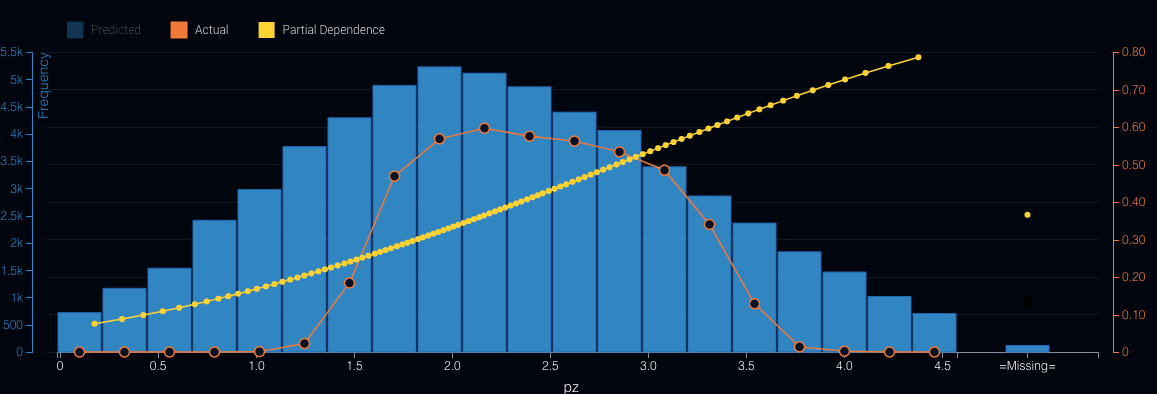 Figure 2: Vertical Pitch Location
As we can see in each case above, the model fails to correctly capture the underlying shape of the strike zone. In the second graph we see that the model will continue to increase the probability of a strike as the pitches’ location rises out of the strike zone.
There are a couple of ways to resolve this issue. The first is to perform some feature engineering. Knowing about the shape of the strike zone, we could create new features that would better capture the actual relationship of pitch location and strike calls. In fact, DataRobot does this automatically for some of the linear models it builds.
We can continue to improve our ability to measure the impact of catchers by controlling for more factors (much like Baseball Prospectus does) including the pitcher, umpire, etc.
Alternatively, as we will do in this blog post, we can use machine learning techniques that will naturally capture this nonlinear behavior. So, again using DataRobot, we built an Extreme Gradient Boosted Tree Classifier using the same data as in the last blog. We get an even better classifier with an AUC of 0.9790, and a very good ROC curve (see Figure 3):
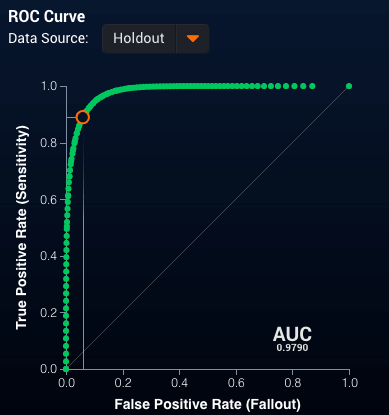 Figure 3: ROC Curve for Extreme Gradient Boosted Tree
With a really strong separation between the predictions for those pitches called strikes and those called balls (Figure 4):
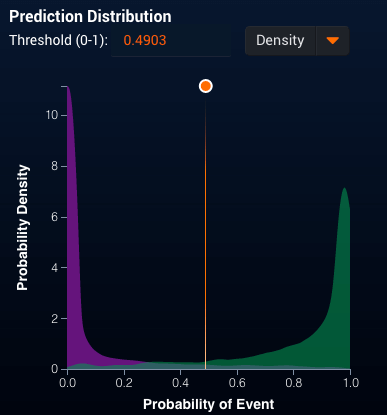 Figure 4: Strike Probability Distribution
This plot does not show the same issues as we saw with the logistic regression from the previous blog. Even better, when we examine the partial dependence plot (see Figure 5) for horizontal location where the pitch crosses the strike zone, we see that the model captures the nonlinear behavior we expect.
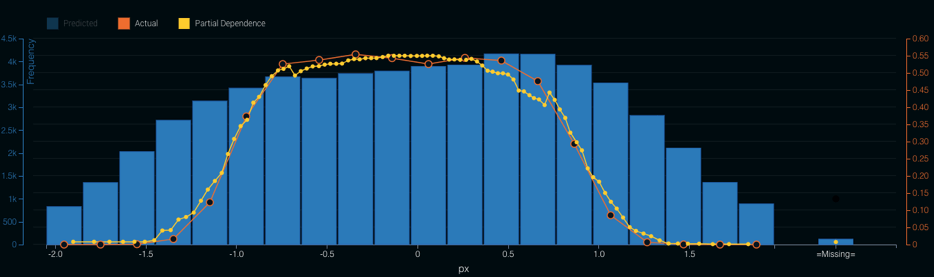 Figure 5: Horizontal Pitch Location
Now, we can follow the same procedure as in the last blog post: score the 2017 pitches, classify the pitch as a strike (if the probability is above 0.5) or a ball (if the probability is below 0.5) to get the top 10 catchers (by pitches framed and runs saved) who saw at least 1000 called pitches:
| Catcher | Extra Strikes | Run Value Extra Strikes |
|---|---|---|
| Tyler Flowers | 232.0365858 | 30.86086591 |
| Austin Hedges | 203.3725528 | 27.04854952 |
| Yasmani Grandal | 199.7461624 | 26.5662396 |
| Christian Vazquez | 157.2397904 | 20.91289213 |
| Martin Maldonado | 148.2925827 | 19.7229135 |
| Roberto Perez | 131.7581427 | 17.52383298 |
| Austin Barnes | 107.8639966 | 14.34591155 |
| Yadier Molina | 105.2044801 | 13.99219585 |
| Jeff Mathis | 75.81434693 | 10.08330814 |
| Chris Iannetta | 68.30385333 | 9.084412492 |
And the bottom 10 Catchers:
| Catcher | Extra Strikes | Run Value from Extra Strikes |
|---|---|---|
| Jonathan Lucroy | -154.9729517 | -20.61140258 |
| Willson Contreras | -149.7586628 | -19.91790216 |
| Alex Avila | -119.5290739 | -15.89736683 |
| James McCann | -113.4678427 | -15.09122308 |
| Salvador Perez | -110.6663694 | -14.71862713 |
| Tucker Barnhart | -109.5072848 | -14.56446888 |
| Carlos Ruiz | -97.0305566 | -12.90506403 |
| Omar Narvaez | -86.30338697 | -11.47835047 |
| Tony Wolters | -84.87993916 | -11.28903191 |
| Luis Torrens | -81.16352524 | -10.79474886- |
Similarly, using the probability that a pitch is a strike to generate the expected number of strikes, we get the following top 10 catchers:
| Catcher | Extra Strikes | Run Value from Extra Strikes |
|---|---|---|
| Tyler Flowers | 239.7852109 | 31.89143305 |
| Yasmani Grandal | 213.0208034 | 28.33176685 |
| Martin Maldonado | 200.9893203 | 26.73157959 |
| Christian Vazquez | 192.3759498 | 25.58600133 |
| Austin Hedges | 184.1466134 | 24.49149959 |
| Roberto Perez | 132.7396991 | 17.65437998 |
| Austin Barnes | 113.79788 | 15.13511804 |
| Yadier Molina | 97.77975527 | 13.00470745 |
| Chris Iannetta | 89.61690475 | 11.91904833 |
| Jeff Mathis | 80.5177744 | 10.708864 |
And the bottom 10 Catchers:
| Catcher | Extra Strikes | Run Value from Extra Strikes |
|---|---|---|
| Jonathan Lucroy | -153.0924258 | -20.36129263 |
| Willson Contreras | -136.9238414 | -18.21087091 |
| Salvador Perez | -131.3031961 | -17.46332509 |
| James McCann | -116.2885564 | -15.46637801 |
| Tucker Barnhart | -115.3709364 | -15.34433455 |
| Alex Avila | -114.617263 | -15.24409598 |
| Cameron Rupp | -99.96482958 | -13.29532233 |
| Carlos Ruiz | -97.49325819 | -12.96660334 |
| Matt Wieters | -90.28809984 | -12.00831728 |
| Tony Wolters | -86.55165562 | -11.5113702 |
We do see some minor changes in our ranking of the catchers due to the improved model. For example, while Austin Hedges is still a top pitch framer, his overall value drops. Meanwhile, Elias Diaz, the Pirates rookie catcher, no longer appears on the bottom of the list. We can continue to improve our ability to measure the impact of catchers by controlling for more factors (much like Baseball Prospectus does) including the pitcher, umpire, etc.
For our next blog in this series, we will explore this improved model and consider an alternate approach using machine learning to evaluate the impact of the catchers on strike calls.

About the Author:
Andrew Engel is a Customer Facing Data Scientist at DataRobot. He works with DataRobot customers in a wide variety of industries, including several Major League Baseball teams. He has been working as a data scientist and leading teams of data scientists for over 10 years in a wide variety of domains from fraud prediction to marketing analytics. Andrew received his PhD in Systems and Industrial Engineering with a focus on optimization and stochastic modeling. He has worked for Towson University, SAS Institute, the US Navy, Websense (now ForcePoint), Stics, and HP before joining DataRobot in February of 2016.

Andrew Engel is General Manager for Sports and Gaming at DataRobot. He works with DataRobot customers across sports and casinos, including several Major League Baseball, National Basketball League and National Hockey League teams. He has been working as a data scientist and leading teams of data scientists for over ten years in a wide variety of domains from fraud prediction to marketing analytics. Andrew received his Ph.D. in Systems and Industrial Engineering with a focus on optimization and stochastic modeling. He has worked for Towson University, SAS Institute, the US Navy, Websense (now ForcePoint), Stics, and HP before joining DataRobot in February of 2016.
-
How to Choose the Right LLM for Your Use Case
April 18, 2024· 7 min read -
Belong @ DataRobot: Celebrating 2024 Women’s History Month with DataRobot AI Legends
March 28, 2024· 6 min read -
Choosing the Right Vector Embedding Model for Your Generative AI Use Case
March 7, 2024· 8 min read
Latest posts
