


D.R.I.V.E.: MLB Projections for the 60-Game 2020 Season
DataRobot Intelligent Value Estimator for 2020 MLB Team and Player Performance
Before the 2020 season started, we predicted how the MLB season would unfold — for teams and for individual players — by leveraging the leading DataRobot AI Platform. Then COVID changed the world. Health, the economy, and our entire way of life have all been fundamentally changed, as have the sports we all enjoy. After months of MLB and the MLBPA discussions, baseball has enacted a 60-game schedule and, hopefully, playoffs.
Who is projected to win each division in the abbreviated season? Who will make the wildcard? Who will be the top pitchers and batters? This article discusses these questions and more, including how our predictions were made and how things would have been different if there were 16 playoff teams, as had been planned at one point.
We love applying artificial intelligence and machine learning to answer large and complex problems, and so baseball analytics is the ideal playground for DataRobot and our data scientists. Thus, we created D.R.I.V.E. MLB: the DataRobot Intelligent Value Estimator for Major League Baseball.
DataRobot is the creator of AutoML — the automation of machine learning — where the platform tries different prediction models with datasets and finds predictions with a higher degree of accuracy quickly and easily. D.R.I.V.E. MLB is a comprehensive prediction system that relies on the same machine learning technology used to deliver over $10 billion in impact to our customers to date. Across all industries, people have used traditional business intelligence to make baseball predictions for decades, such as PECOTA, STEAMER, and ZiPS. Building on this foundation, artificial intelligence takes things to the next level by trying to understand the complexities and subtleties of how information is connected, such as the real-life human behavior of baseball players.
Built with the DataRobot automated machine learning platform, D.R.I.V.E. MLB predicts Wins Above Replacement (WAR – the most common metric for total player performance) for every player in MLB, as well as ancillary stats like wOBA, wRC, and ERA-. By using these player-level predictions, we can also predict team win-loss records, division standings, playoff brackets, and even MVP and Cy Young winners.
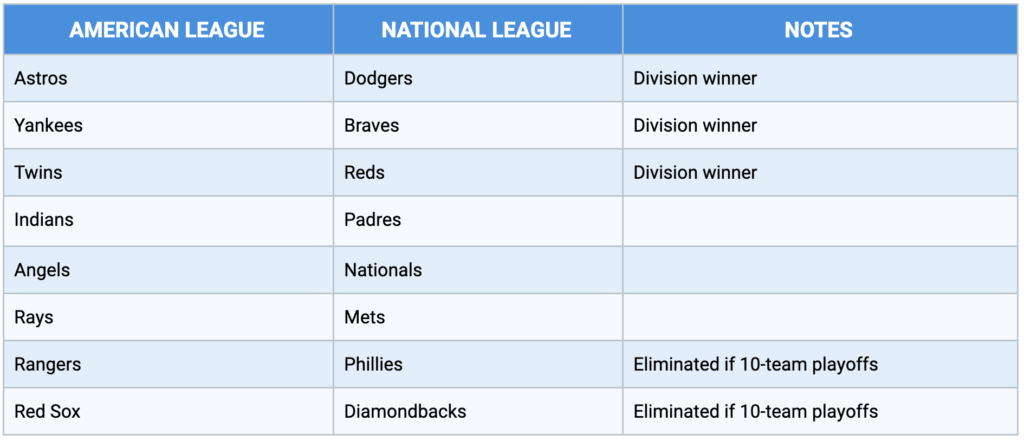
Hypothetical 16-Team Playoff Field
We were also curious what the 16-team playoff field would look like. Using the same projection system above, we recut the results for the top eight teams in each league to fill out the field.
Hypothetical 16-Team Bracket:
- National League
- (1) Dodgers* vs. (8) Diamondbacks
- (2) Braves* vs. (7) Phillies
- (3) Reds* vs. (6) Mets
- (4) Padres vs. (5) Nationals
- American League
- (1) Astros* vs. (8) Red Sox
- (2) Yankees* vs. (7) Rangers
- (3) Twins* vs. (6) Rays
- (4) Indians vs. (5) Angels
*Division Winners
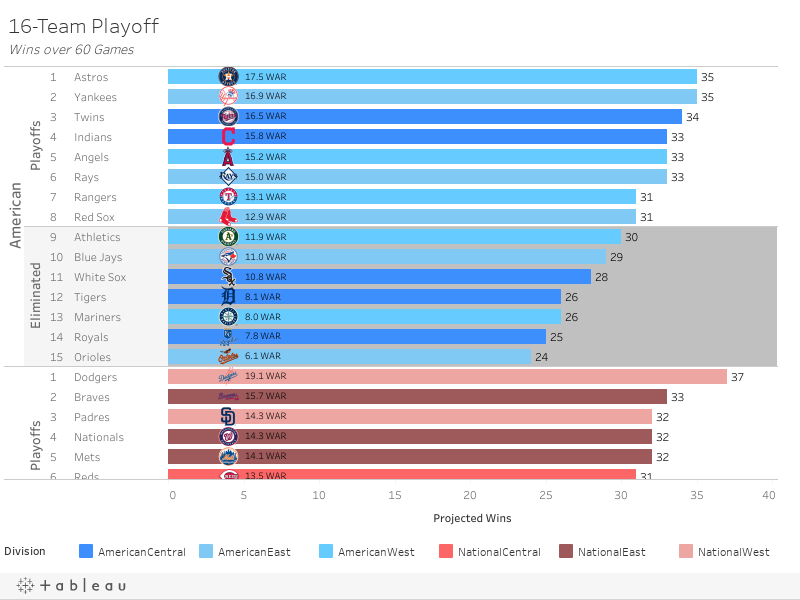
What’s important to remember about this projection, this season, and the variability of baseball is that even with eight teams making the playoffs, the differences in wins between the 1st seeds and the 9th seeds is only five wins and seven wins in the American and National Leagues respectively. In the reality of five-team playoffs in each league, the margin for error will be even smaller.
See our prior post for additional details on the methodology and how we took roughly 1,500 season-specific statistics for each player and added 2,000 additional variables for each player, leveraging the DataRobot AI Platform to make our predictions.
The Results
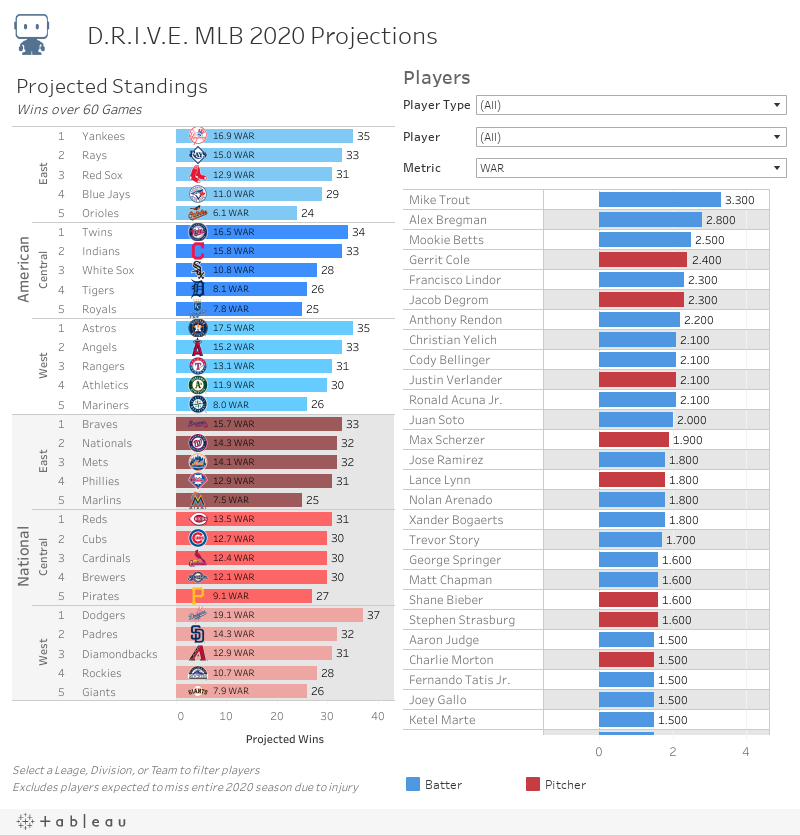
Tableau is the leading visualization solution on the market, enabling business users across a business — and in this case the public — to get value from DataRobot’s AI-based projections. Our D.R.I.V.E. MLB Tableau dashboard below shows DataRobot’s projections for the 60-game 2020 MLB season, with final win-loss records, division standings, and player performance. Many of our customers deploy the predictions they get from DataRobot through Tableau as well* since it makes for a useful combination of insights and interpretation.
*With the DataRobot and Tableau tech stack, once a model has been built in DataRobot, customers can easily democratize the value of machine learning for insight consumers at large with actionable, intelligent dashboards from Tableau. Visit the Tableau Extension Gallery to get the DataRobot extension, and download the DataRobot Starter Kit for Tableau to learn more.
Given these results, we can predict the following about the 2020 season:
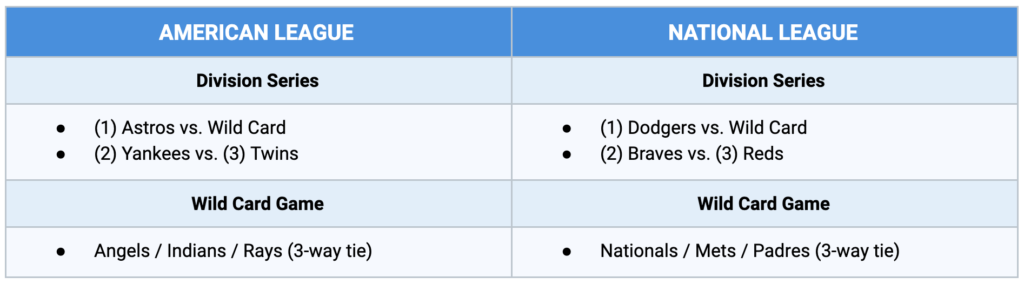
2020 Playoffs Matchups:
Playoff teams project to the following wins:
- Astros (35), Yankees (35), Twins (34), Angels (33), Indians (33), Rays (33)
- Dodgers (37), Braves (33), Reds (31), Nationals (32), Mets (32), Padres (32)
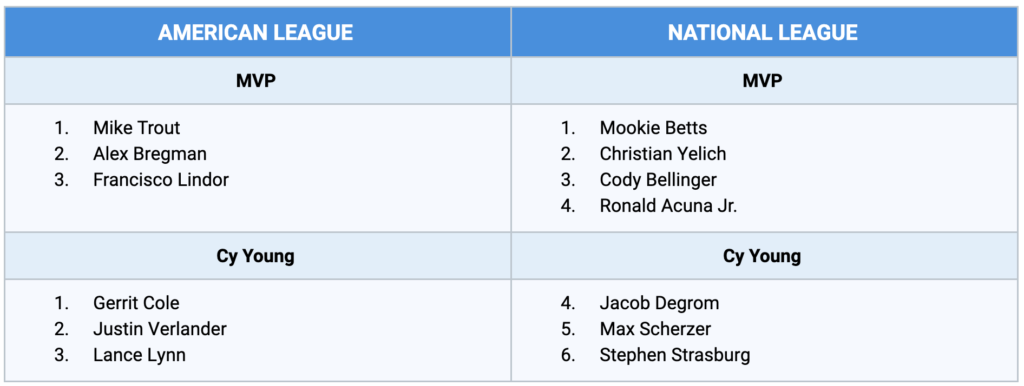
2020 Major Individual Awards:
“What If” There Were 16 Teams in the Playoffs?
At one point, MLB was considering a 16-team playoff scenario. What would that have looked like, given DataRobot’s forecasts? In addition to the 10-team playoff teams, the Rangers and Red Sox would have also made the playoffs in the American League. The Phillies and Diamondbacks from the National League.
Conclusion
The Dodgers, Yankees, Astros, Mike Trout, Alex Bregman, and Mookie Betts are projected to be the top teams and players in the shortened season. Using machine learning, baseball can predict future performance based on past information. Similarly, any industry can predict future performance where chance, human behavior, and the complexities among various data sources are involved. We hope to hear your thoughts.

Andrew Engel is General Manager for Sports and Gaming at DataRobot. He works with DataRobot customers across sports and casinos, including several Major League Baseball, National Basketball League and National Hockey League teams. He has been working as a data scientist and leading teams of data scientists for over ten years in a wide variety of domains from fraud prediction to marketing analytics. Andrew received his Ph.D. in Systems and Industrial Engineering with a focus on optimization and stochastic modeling. He has worked for Towson University, SAS Institute, the US Navy, Websense (now ForcePoint), Stics, and HP before joining DataRobot in February of 2016.

Sarah is an Applied Data Scientist on the Trusted AI team at DataRobot. Her work focuses on the ethical use of AI, particularly the creation of tools, frameworks, and approaches to support responsible but pragmatic AI stewardship, and the advancement of thought leadership and education on AI ethics.

He has led or advised CEOs in digital transformations across several industries and geographies. He lives in Dallas, TX with his wife and dog. Prior to joining DataRobot, he was Head of Digital and Transformation at TSS, LLC and a consultant at McKinsey & Co.
-
How to Choose the Right LLM for Your Use Case
April 18, 2024· 7 min read -
Belong @ DataRobot: Celebrating 2024 Women’s History Month with DataRobot AI Legends
March 28, 2024· 6 min read -
Choosing the Right Vector Embedding Model for Your Generative AI Use Case
March 7, 2024· 8 min read
Latest posts
