

D.R.I.V.E. 2020 MLB Projections: DataRobot Intelligent Value Estimator
At DataRobot, we love problems that involve large sets of data, discrete cause-and-effect events, and difficult predictions; which makes baseball the ideal playground for our data scientists. On our normal days, we work closely with our customers to build prediction models that demystify the future with advanced machine learning techniques. With the current lack of baseball games to watch and enjoy due to delays to the 2020 season, we set our attention, skills, and technology towards exploring the unknowns of the expected 2020 season – who would have performed, who would have won, and who wouldn’t; a lot of which we’ll still see play out when the games return. Thus, we created D.R.I.V.E. MLB: the DataRobot Intelligent Value Estimator for Major League Baseball.
D.R.I.V.E. MLB is a comprehensive prediction system that relies on the same machine learning technology used to deliver over $10 billion in impact to our customers to date. Built with the DataRobot Automated Machine Learning platform, D.R.I.V.E. MLB predicts Wins Above Replacement (WAR – the most common metric for total player performance) for every player in MLB, as well as ancillary stats like wOBA, wRC, and ERA-. By using these player-level predictions, we can also predict team win-loss records, division standings, playoff brackets, and even MVP and Cy Young winners.
We are not the first to undertake this type of prediction system. There are many other high-quality player projection systems available to the public today (ZiPS, PECOTA, STEAMER to name a few). Each of these systems has a great track record of using generally-accepted techniques for predictions. However, there is a common shortcoming to them all in that they rely on either direct comparisons to the past or simple regression techniques to look into the future. A more nuanced, machine learning-driven analysis of the data will identify deeply ingrained patterns and trends, and should lead to a higher degree of accuracy in our predictions.
Our Methodology
D.R.I.V.E. MLB models were built upon a dataset going back to 1998, and includes roughly 1,500 season-specific statistics for each player – everything from age, to wRC+, to days on the Injured List. We created approximately 2,000 more variables for each player via feature engineering, capturing relevant information from previous seasons in an attempt to allow the model to understand their trajectories as players. After building this massive dataset, we then relied on DataRobot to do the heavy data science lifting of training and evaluating many dozens of different machine learning models to determine which model (or ensemble of multiple models) would give us the best predictions for the 2020 season. Normally, this modeling stage of the data science process would’ve taken weeks, but our team could iterate quickly with automated machine learning from DataRobot, building models overnight and then going back to the data acquisition and preparation to refine our approach.
When the automated machine learning process was done, one model emerged as the winner out of a total of more than 65 high-performing competitor models. Competitor models included many variations and blends of Random Forests, Support Vector Machines, TensorFlow Deep Learning, Vowpal Wabbit, and Keras Neural Networks. The winning model was a Gradient Boosted Trees Regressor. This took advantage of bootstrap re-sampling of trees, where each successive tree was fitted to the residual errors of all previous trees combined. Early stopping was leveraged to maximize model accuracy while avoiding overfitting on the training data.
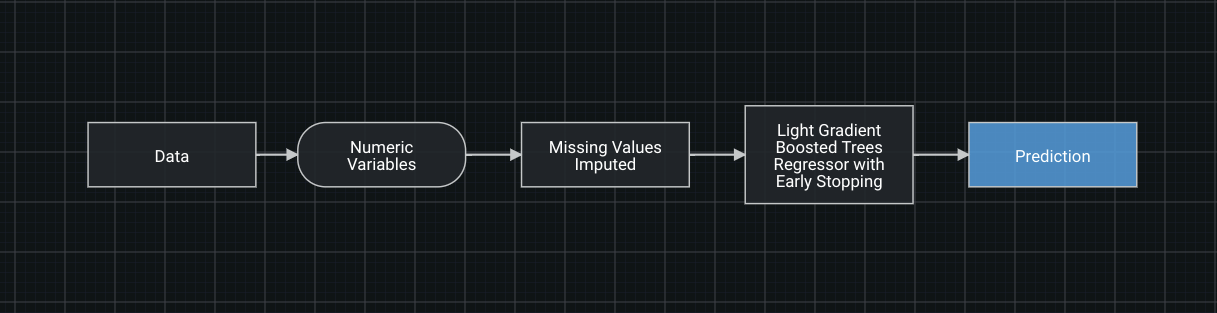
When we tested our models for accuracy, this winning model scored the best on “RMSE”, which is an advanced metric for computing the errors in model predictions vs. actual outcomes.
The Results
The Tableau dashboard below shows our projections for the 2020 MLB season, with final win-loss records, division standings, and player performance. We took the results from our model and made them available for consumption by a wider audience through a Tableau dashboard, as many of our customers deploy the predictions they get from DataRobot through Tableau as well* since it makes for a useful combination of insights and interpretation. The Boston Red Sox spoke to just this value in a recent DataRobot webinar (skip ahead to the 36:30 timestamp).
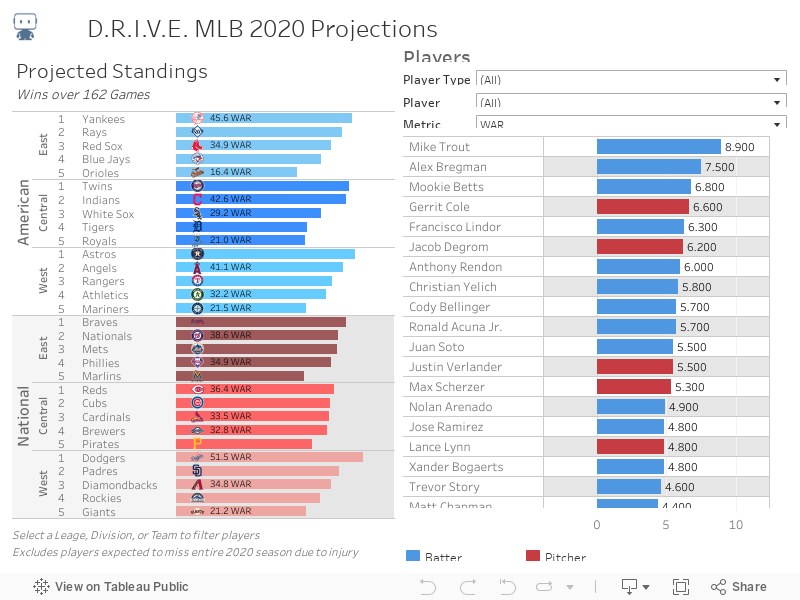
Given these results, we can predict the following about the 2020 season:
2020 Playoffs Matchups:
| American League | National League |
| Division Series | Division Series |
| (1) Astros vs. Wild Card (2) Yankees vs. (3) Twins |
(1) Dodgers vs. Wild Card (2) Braves vs. (3) Reds |
| Wild Card Game | Wild Card Game |
| (5) Angels at (4) Indians | Nationals / Mets / Padres (3-way tie) |
2020 Major Individual Awards:
| American League | National League |
| MVP | MVP |
|
|
| Cy Young |
Cy Young |
|
|
Lastly, we built a match-up viewer that would allow you to see how any two teams compare head-to-head:
How the Model Worked
We believe machine learning shouldn’t be a black box, so we used DataRobot’s interpretation and evaluation tools to understand how our model worked.
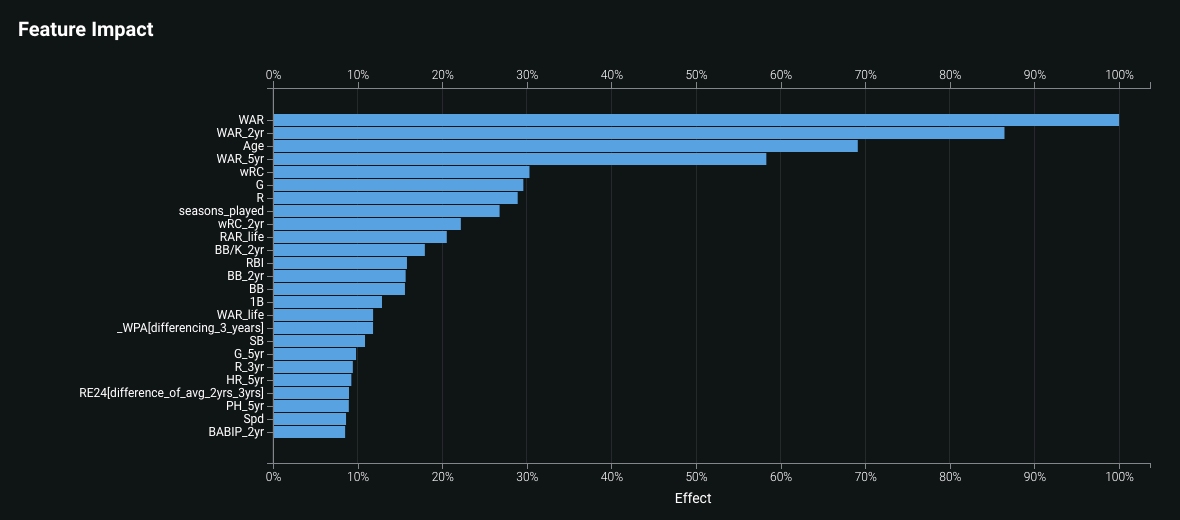
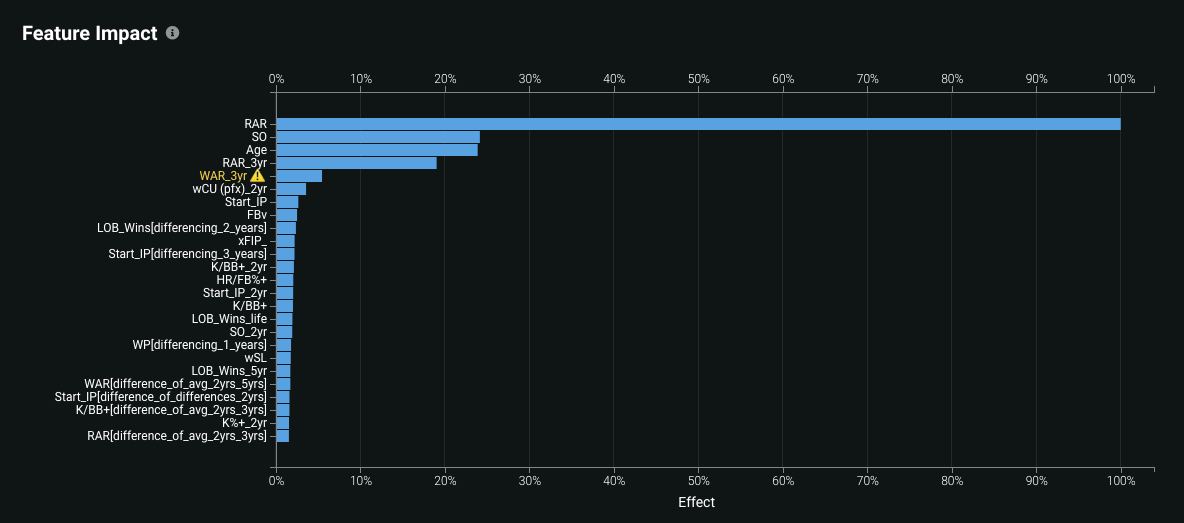
DataRobot uses “Feature Impact” to communicate which variables put into the model had the most impact on the final predictions. Think of it like the weight the model puts to a variable. Of the thousands of features that were used to create the WAR predictions, the top features for batters included:
- WAR from the previous season
- Average WAR from several recent seasons (2 year avg, 5 year avg)
- Age of the player
- wRC from the previous season
Similarly, the top features which contributed to the pitcher WAR predictions included:
- RAR from the previous season
- SO from the previous season
- Age of the player
- Average RAR from several recent seasons (3 year avg)
Conclusion
While we currently lack of sports to watch and enjoy due to the current pandemic, we hope that this blog helps keep everyone entertained and asking “what if?” for the 2020 season.
Beyond just saying that the Dodgers, Yankees, Astros, Mike Trout, Alex Bregman, and Mookie Betts will all be very good, we can also use this as an opportunity to test the limits of prediction in performance. Depending on how much of the season gets played (or if it gets played), we’ll be able to see the comparative advantage of machine learning to solving the problem of future human performance not just in baseball, but in any field where chance, entropy, and data are involved. We’ll look forward to a season-ending comparison of our predictions vs. actual results vs. other prediction systems.
By providing an interactive dashboard, you can play out every player projection and every team standing. We welcome all feedback!
* – With the DataRobot and Tableau tech stack, once a model has been built in DataRobot, customers can easily democratize the value of machine learning for insight consumers at large with actionable, intelligent dashboards from Tableau. Visit the Tableau Extension Gallery to get the DataRobot extension, and download the DataRobot Starter Kit for Tableau to learn more.

Andrew Engel is General Manager for Sports and Gaming at DataRobot. He works with DataRobot customers across sports and casinos, including several Major League Baseball, National Basketball League and National Hockey League teams. He has been working as a data scientist and leading teams of data scientists for over ten years in a wide variety of domains from fraud prediction to marketing analytics. Andrew received his Ph.D. in Systems and Industrial Engineering with a focus on optimization and stochastic modeling. He has worked for Towson University, SAS Institute, the US Navy, Websense (now ForcePoint), Stics, and HP before joining DataRobot in February of 2016.

Sarah is an Applied Data Scientist on the Trusted AI team at DataRobot. Her work focuses on the ethical use of AI, particularly the creation of tools, frameworks, and approaches to support responsible but pragmatic AI stewardship, and the advancement of thought leadership and education on AI ethics.

He has led or advised CEOs in digital transformations across several industries and geographies. He lives in Dallas, TX with his wife and dog. Prior to joining DataRobot, he was Head of Digital and Transformation at TSS, LLC and a consultant at McKinsey & Co.

Michael is a Data Scientist at NIM Group. He previously served as Supply Chain Analytics Manager at Apex Tool Group. Before that, Michael leveraged analytics in the Engineering and Manufacturing domains at Michelin North America. Michael holds a B.S. in Mechanical Engineering from Clemson University.
-
How to Choose the Right LMM for Your Use Case
April 18, 2024· 7 min read -
Belong @ DataRobot: Celebrating 2024 Women’s History Month with DataRobot AI Legends
March 28, 2024· 6 min read -
Choosing the Right Vector Embedding Model for Your Generative AI Use Case
March 7, 2024· 8 min read
Latest posts
