


Predicting Music Genre Based on the Album Cover
This post is meant to be an enjoyable and unique way to explore Visual AI.
As someone who spends hours searching for new music, getting lost in rabbit holes of ‘related artists’ or ‘you may also like’ tabs, I wanted to see if cover art improves the efficiency of the search process. Browsing through a collection of images takes a lot less time than listening to clips of songs. As a starting place, I was curious if machine learning could accurately predict an album’s genre from the cover art. In this post, I will show you how I built this model and what it teaches us about the role a record’s cover plays in categorizing and placing an artist’s work into a musical context.
Building the Dataset and Model
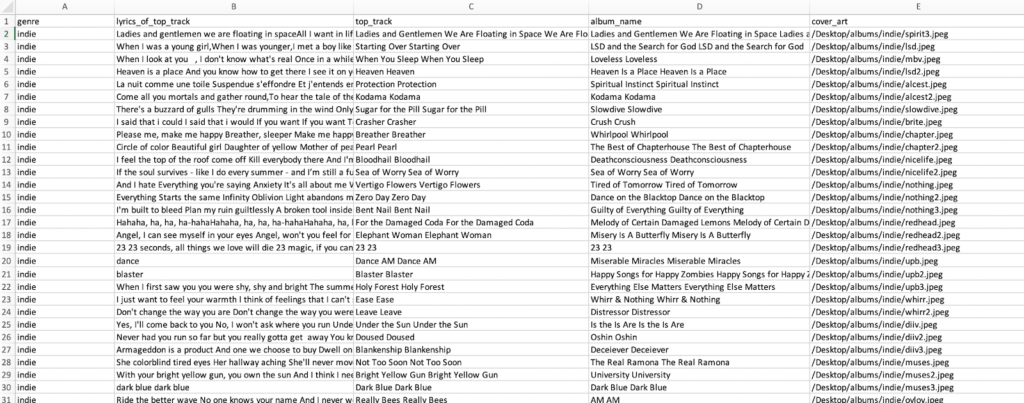
I leveraged the Spotify API to collect metadata on 277 songs that fell into the three genres, indie, rock, and pop. This data included the title of the track and the title and the cover art of the track’s album. If you are interested in the specifics of how I used the API, you can check that out here. I also copied the track’s lyrics from the web.
Take a look here to see further detailed steps on how to prepare your image datasets.
Once you have your dataset constructed, the next step is to import that data into DataRobot and set the target. You can also customize the modeling settings and explore the data at this stage. I set the target to genre, which is considered a multi-class classification problem.
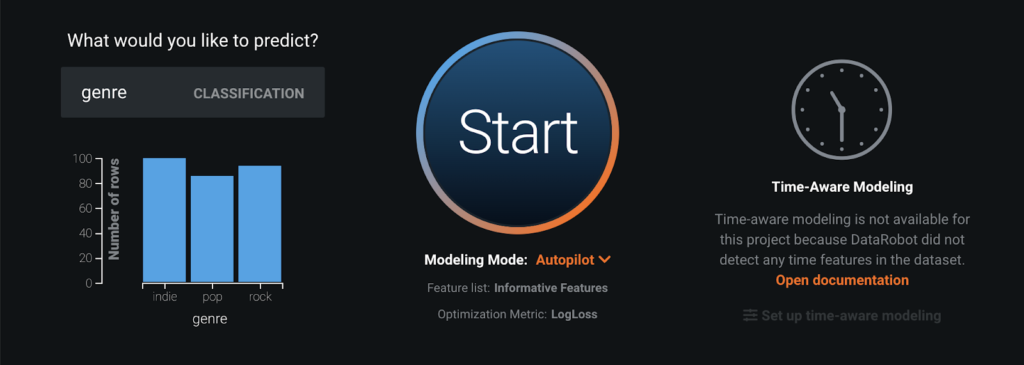
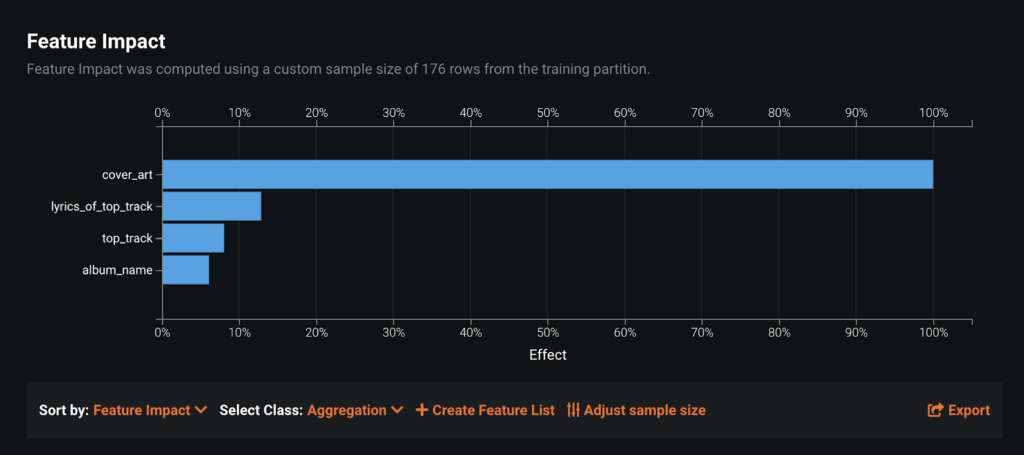
The next step is to push the Start button; this will kick off the Autopilot modeling process. DataRobot then built 22 different types of models and blenders. I also created a couple of different feature lists to see if some feature selection could boost the original accuracy. When I used all the features, I found by using feature impact that the top_track and album names did not have much of an effect.
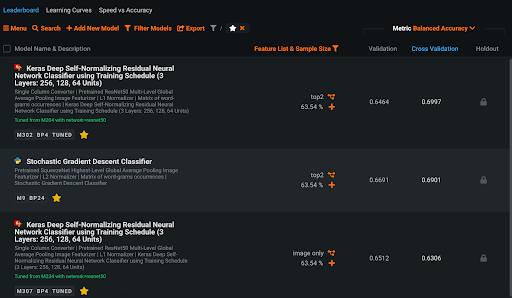
The best performing model was the Keras Deep Self-Normalizing Residual Neural Network Classifier built on the feature list, ‘top2’ performed the best. (top2 consists of the cover art and the lyrics of the top track) I will also touch on a Keras Deep Self-Normalizing Residual Neural Network Classifier model built on the “image only’ feature list. The key part of these models is the image featurizer, which converts images to numeric feature vectors using a pre-trained neural network (this is known as transfer learning). DataRobot has nine different pre-trained networks, and they are also the reason why DataRobot doesn’t require thousands of training images. Under the ‘Advanced Tuning’ tab, I was able to retrain the blueprint on ResNet. ResNet provides higher performance on model accuracy, but does take longer to train.
Model Evaluation
DataRobot allows you to evaluate the model’s accuracy in predicting the various classes of genres. DataRobot, by default, runs five-fold cross-validation. Since this is a multi-class classification problem with a balanced dataset, I recommend looking at the ‘Balanced Accuracy’ metric. Balanced Accuracy is an average of the class-by-class, one-vs.-all accuracy, so the closer to 1, the better. Our ‘top2’ model has a 0.6997 cross-validation score. Our ‘image only’ model has a 0.6306 cross-validation score. These scores suggest that the model predicts a little more than half correct with just images alone, which is not bad considering the problem’s difficulty and small dataset.
The Confusion Matrix shows this concept visually, it compares actual data values with predicted data values, making it easy to see if any mislabeling has occurred and with which values.
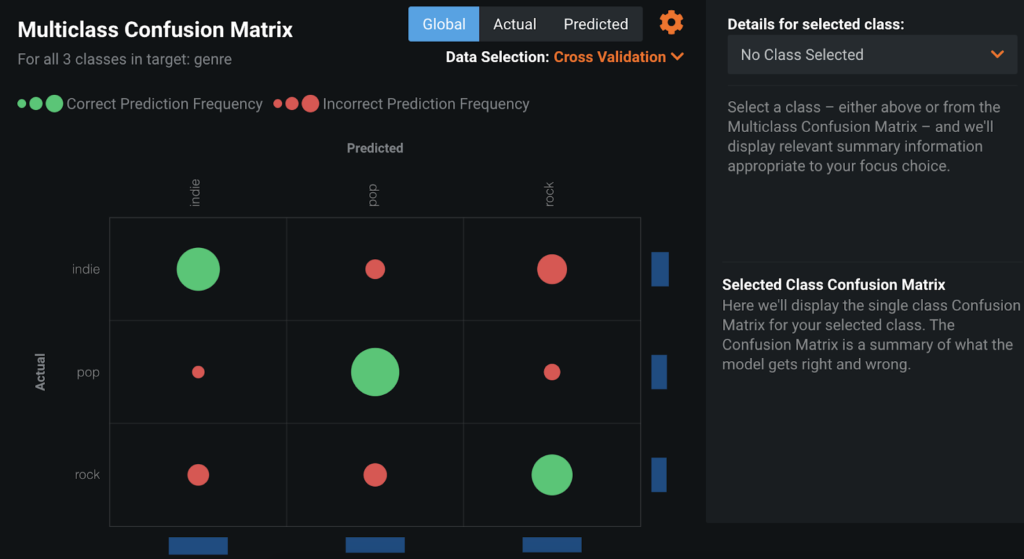
The green circles represent correct predictions, while the red circles represent incorrect predictions. The size of a circle is a visual indicator of the occurrence (based on row count) of correct and incorrect predictions. Overall, this chart indicates the model performs pretty well, the green circles are large, and the red circles are small. I think it’s interesting to note that the most misclassifications occur as “indie” mislabeled as “rock” and “rock” mislabeled as “indie.” Since rock and indie are more closely related genres than either of the two with pop, this makes sense.
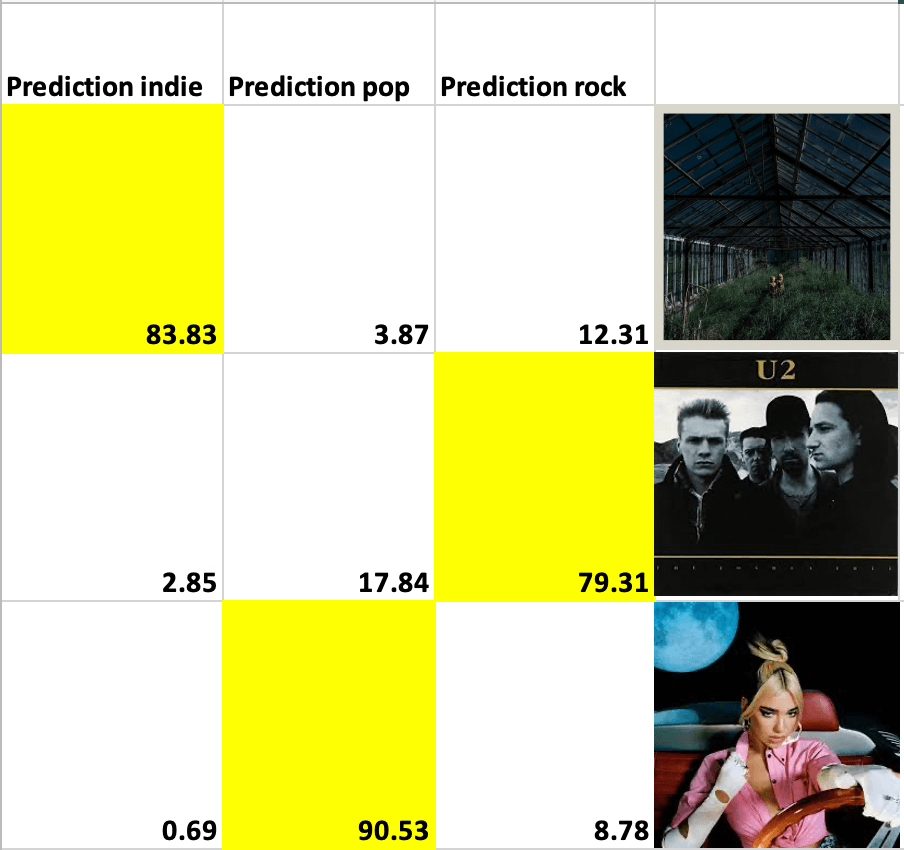
I also scored a couple of new albums on the model and downloaded their predictions, here are three of the albums next to their predictions for each class (as rounded percentages). I highlighted the largest score.
Model Insights
With DataRobot, you can visually assess your models using two insight capabilities: image embeddings and activation maps and using two text-specific insights: text mining and word clouds.
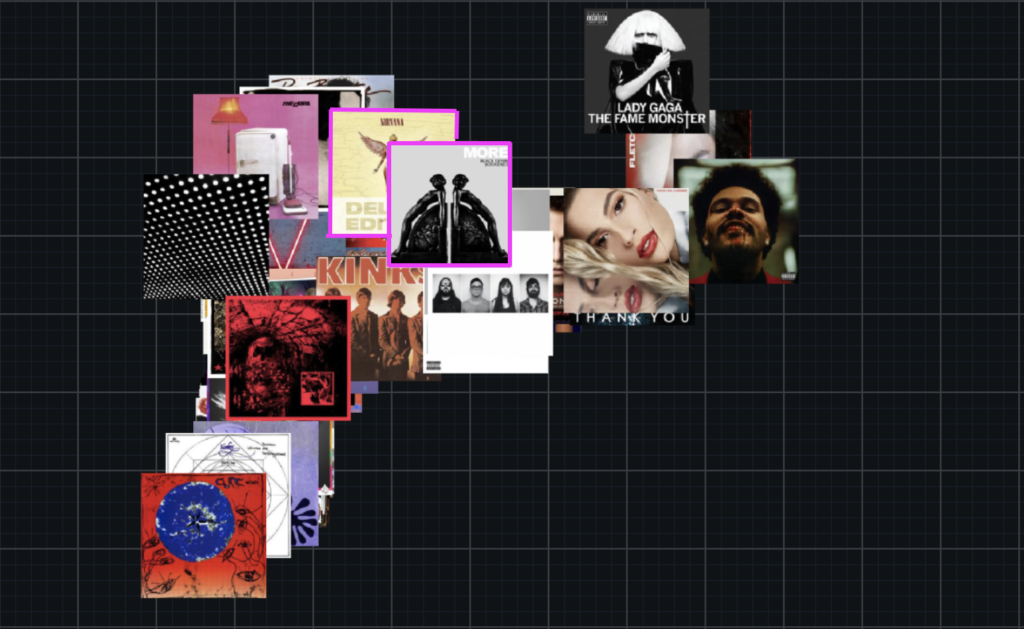
With Activation Maps, you can see which image areas the model uses when making predictions—which parts of the images drive the algorithm prediction decision. Filters allow you to narrow the display based on the predicted and actual class values. Below is part of the activation map’s full sample; it has examples from all three genres. I have added colored boxes in blue, orange, and red to highlight some patterns in the activation maps.
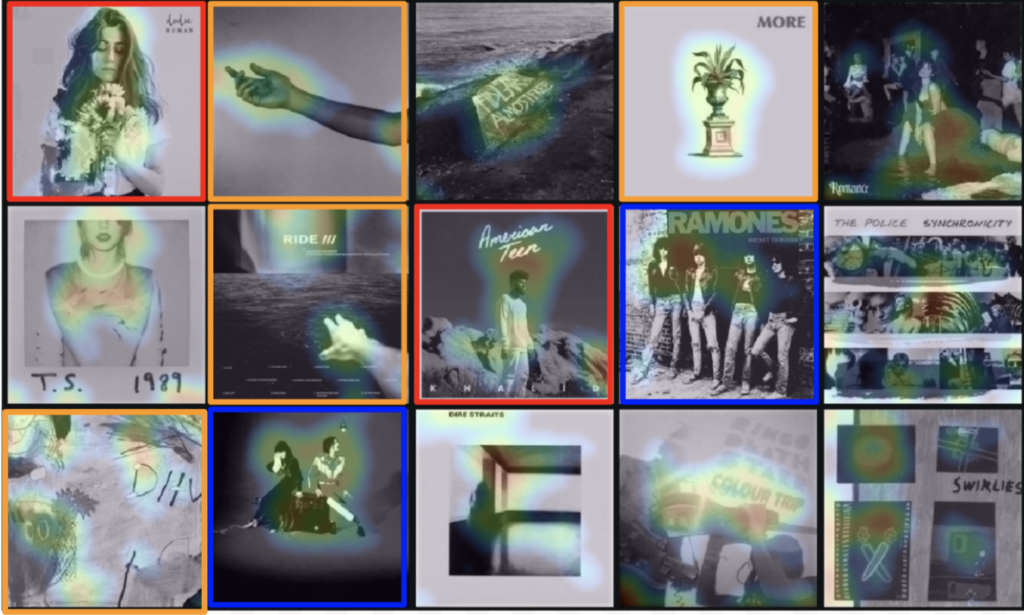
Looking at the indie albums, like the ones highlighted in orange, I notice they tend to feature more conceptual art. They have random objects, or abstract art, with only the occasional figure. It’s neat that the model caught the hands in two of them. Apparently indie artists like featuring the real music-makers.? Pop albums, like the ones highlighted in red, have a singular figure highlighted. Most popular music originates from solo artists, and even famous bands like the Beatles eventually break up to pursue solo careers. Their fans will see them and quickly support the album as soon as they encounter it. For rock albums, the model mostly focuses on the groups of people, highlighted in blue. Though rock musicians are also known to have concept cover art, the note about the model mislabeling “rock” as “indie” makes sense for those instances.
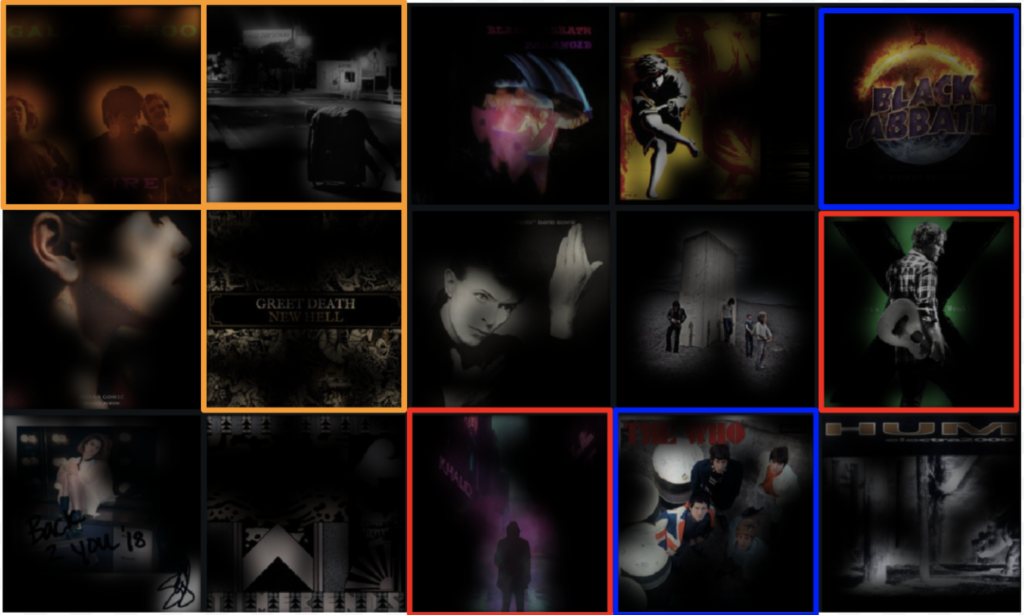
For some cover art, the activation maps show us how the model focuses on color and clarity. Again, I highlighted in orange some of the indie cover art. The colors in these are very muted, and even though two have figures, they are faded and hard to make out. The rock and pop covers have more saturated or deep colors. The pop albums, highlighted in red, might seem to fit indie more because the figure isn’t in a portrait style, but the bright pink and green colors don’t follow the indie palette. The top blue is an example of a rock album with concept art, so it might seem to fit indie more, but the bright blue, purple, and orange coloring doesn’t fit. The bottom blue is very similar to the indie cover in the top left corner, it doesn’t have as vibrant colors, but the faces and figures are much more distinct and clear.
With Image Embeddings, you can view projections of images in two dimensions to see the visual similarity between a subset of images and help identify outliers. Filters allow you to narrow the display by class, and zoom controls allow you to zoom in (and out) on the display. Hovering over an image lets you view its associated class, so you can use that to see whether the images are grouped in a way you would expect. The default display shows the full sample, shown below.
You can see a slight separation between album covers with one musician featured (right) to groups featured (middle) and more conceptual (left). Pop musicians brand themselves as individuals. They have fierce fan bases that look for their favorite idol on the cover of their records, so it makes sense that the embeddings have the pop covers grouped to the right with the single figure covers. The embeddings also show a gradient of abstraction; the bottom left has indistinguishable shapes and lines while the top left has more explicit objects. You can even see the ones in the top middle that bridge objects and figures together. Highlighted in pink, one has a human-like form with wings, and the other has two figured statue bookends.
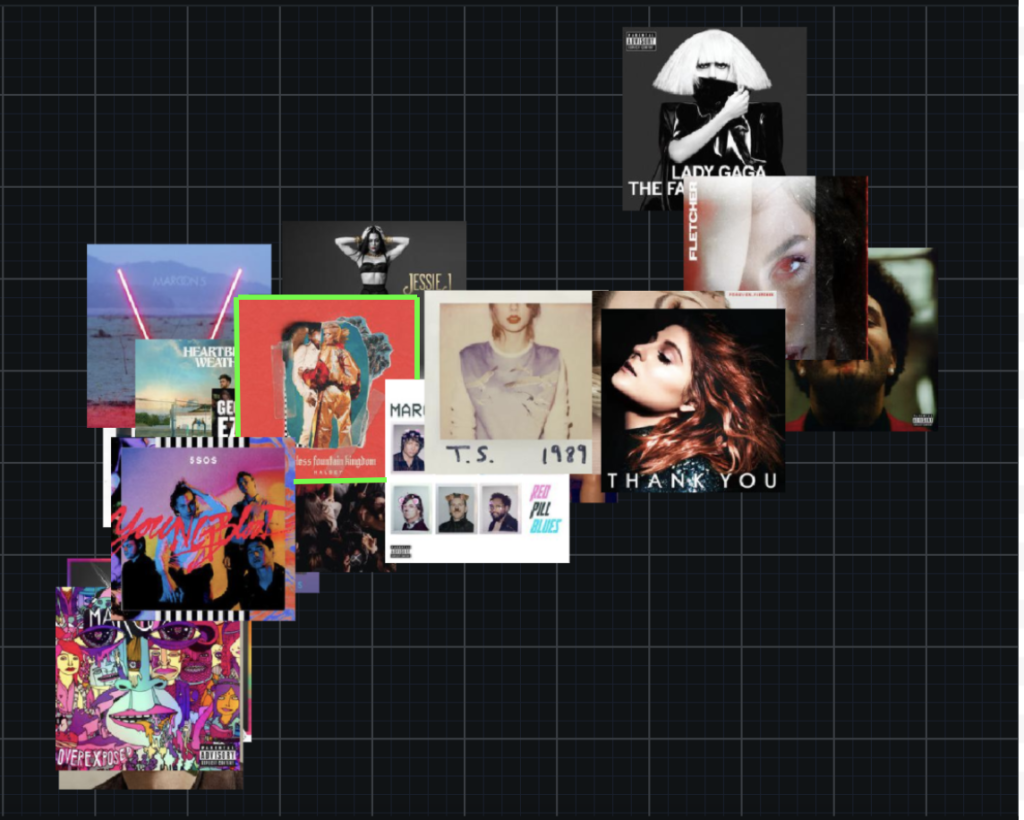
When I filter the embeddings to class “pop,” you can see more distinct color patterns. The bright and colorful albums are lower, while the darker monotone albums are higher. The more comic-esque covers are to the left, while the covers with portraits are to the right. Then, like the one highlighted in green, graphic art figures bridge the two groups. The top left has a couple with landscapes, which is unique from the rest.
With Word Clouds, text strings are displayed in a color spectrum from blue to red, with blue indicating a negative effect and red indicating a positive effect. The text strings that appear more frequently are displayed in larger font sizes, and those less frequently are displayed in smaller font sizes. The example below is for the feature ‘lyrics_of_top_track” class ‘indie.’
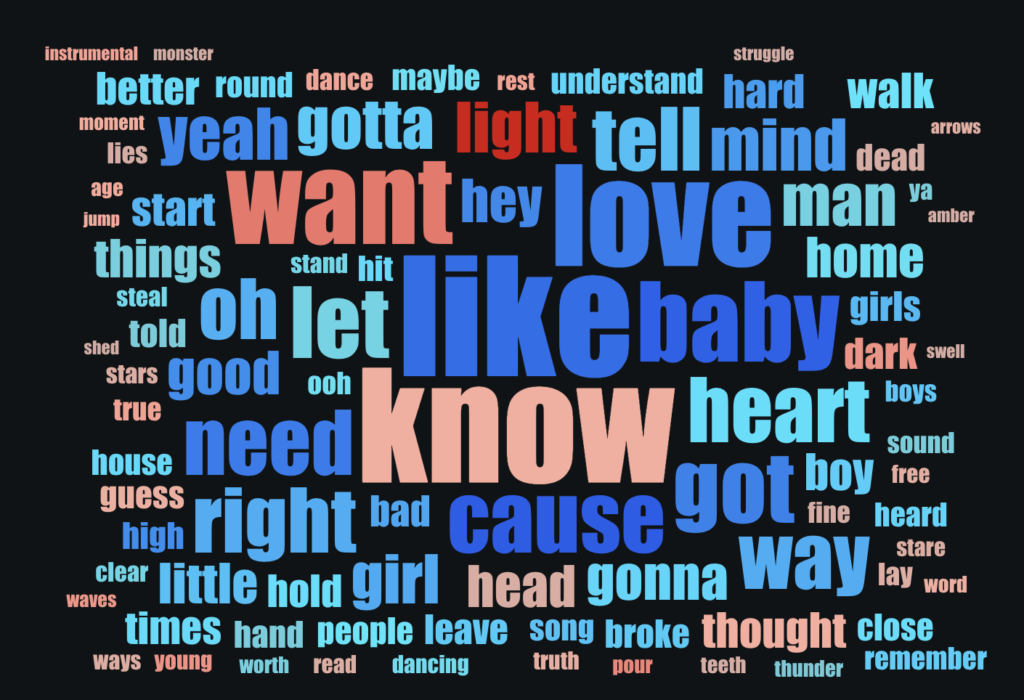
This insight is, by far, my favorite, especially in the context of lyrics. Indie songs tend to be sadder and introspective, so it follows that words like “yeah,” “oh,” and “hey” don’t appear often, or at all, in the lyrics. Words such as “thought,” “dead,” and “struggle” definitely go more with the themes of indie songs.
Conclusion
In the age of digital music, where streaming platforms lead to endless listening options, cover art acts as a visual thumbnail. Striking covers or odd covers could be a determinant for a person looking to try new music, and there are recognizable characteristics indicating genre. This project taught me a lot about those characteristics for indie, pop, and rock albums. Indie musicians approach the cover art with greater artistic freedom, using it to reflect the creative concept behind the music more accurately instead of commercial recognition. Pop and even rock lean more into commercial success, and the portraits are an excellent way to create a more personal connection. Through posture, gesture, facial expression, and even the artist’s fashion sense, the audience can get to know more about their musical style.
One application for this model could be scoring playlists for quicker album discovery. One of my favorite Spotify features is the “Discover Weekly” playlist, a list of around 30 songs similar to other songs you have previously “liked.” Instead of going through all 30 songs, you could use the Spotify API to send the model the songs’ album covers, and then only listen to the songs of genres you prefer. Another potential application could be for marketing purposes. If someone listens to records with gothic cover art, suggest items that go with such an aesthetic, combat boots, ripped black jeans, dark lipstick, black hair dye, and similar attributes.
To improve the results I already have, I would add more photos to the dataset. Some other things that would be cool to test out could be adding more genres or trying a binary classification between album covers and whether it’s an album I like or an album that charted. The Spotify API also has a popularity measure, so building a regression model that predicts an album’s popularity could also be interesting. It looks like I have more models to build.

Sara interned with DataRobot in the summer of 2020 with a focus in customer-facing data science. Sara is currently working towards her B.S. in Data Science as a senior at the University of Michigan.
-
How to Choose the Right LLM for Your Use Case
April 18, 2024· 7 min read -
Belong @ DataRobot: Celebrating 2024 Women’s History Month with DataRobot AI Legends
March 28, 2024· 6 min read -
Choosing the Right Vector Embedding Model for Your Generative AI Use Case
March 7, 2024· 8 min read
Latest posts
