

Tackling Churn with AI – Before Modelling
This accelerator will teach the problem framing and data management steps required before modelling begins. We will use two examples to illustrate concepts: a B2C retail example, and a B2B example based on DataRobot’s internal churn model.
Request a DemoCustomer retention is central to any successful business and machine learning is frequently proposed as a way of addressing churn. It is tempting to dive right into a churn dataset, but improving outcomes requires correctly framing the problem. Doing so at the start will determine whether the business can take action based on the trained model and whether your hard work is valuable or not.
This blog will teach the problem framing and data management steps required before modelling begins. We will use two examples to illustrate concepts: a B2C retail example and a B2B example based on DataRobot’s internal churn model.
One of the fundamental misconceptions about modelling churn is that a good churn model will reduce churn. Even an excellent model will have no impact on churn by itself. It will just correctly identify at risk customers. It is the consumers of the model’s predictions who take action to retain customers. In fact, if a churn model perfectly predicts which customers will leave, it means the interventions had no impact on customer retention.
Sometimes these interventions can be automated, like triggering an email with a discount. Often it is a person who decides whether and how to intervene. This means that as we build a churn model, we need our end users to trust the model and consider its recommendations in their actions. Keeping our end users in mind is a theme that will be present throughout our blog series as we demonstrate how to build a useful churn model.
Problem Framing
To frame this problem, we need to identify stakeholders, create three business definitions, and then decide on the consumption plan. Stakeholders will help with every section, which is why we need to identify them first.
Identify stakeholders
Because our end users are so critical to the success of the churn modelling project, it is important to identify the right people. To identify them, you can ask: who cares about this? Who is responsible for reducing churn? Who will take action once the model identifies a high-risk customer? Bring these stakeholders in early. They need to trust the results, or else they might ignore them. Their feedback can often provide ideas for feature engineering, improve data quality, and make the model actionable for the business.
Define churn
The next step is to define churn, which your stakeholders can help do. This tends to be segmented by the business model. Note that within a company, it is possible to have multiple business models for different revenue streams, so your definition of churn may need to vary by product or service offering!
For subscription-based business models, this is typically whether a customer renews their subscription. In our B2B example, customers typically have annual subscriptions, so our churn definition uses whether they renew their contract. Revenue could also be a factor in this definition, where any downsell might also be considered churn.
In retail-like business models, where customers make individual purchases (not limited to retail businesses, this applies to other industries too!), this is typically related to whether a customer makes a purchase in some window of time. In our B2C example, churn is defined as a customer who does not make any purchases in the next 3 months. This could be the next 6 months, or the next 30 days, etc. It also could use a revenue threshold, where a customer purchases at least $50 worth of products or services. Ultimately your stakeholders will have the best idea on what definition will be most valuable to the business, which is why it’s important that they sign off on this definition.
Population
We also need to define our population, which will impact who we end up training and making predictions on. Determining the boundaries of this population requires understanding the business goals and listening to stakeholders. There may be a specific group of customers that the business cares about retaining, such as mid-sized and large companies. Maybe there is one product that is particularly important. Or there could be no differentiation, and the business wants to predict on all customers. Ultimately, your stakeholders will make this decision, which is why it’s important to discuss this with them.
In the B2C example, the focus is on retaining customers who had placed an order in the previous 3 months. This was a commonly used definition for various metrics throughout the business. Using a common definition pays dividends down the churn-modelling road because the model will align with existing processes and analyses.
In the B2B example, the population of interest started as customers with a managed cloud subscription. We used this restriction because we had more data available for those customers. Over time, this definition was expanded to include all other customers. This approach allowed us to solve for the easier population first and prove value quickly. Then we could address the population which is harder to predict.
Prediction point
Finally, we need to define our prediction point. This is the time at which we will make predictions about churn. If you plan to operationalize your model (make predictions on new customers), it is important this aligns to the time at which you make predictions in production. Remember that the end goal is to prevent churn, so these prediction points need to be early enough for your stakeholders to intervene and prevent churn. These prediction points should also be spaced out far enough that there is a meaningful chance for churn risk to change. If your customers typically make one purchase a week, then making a new prediction every day is unlikely to add much value beyond a model which predicts once a week. The simpler your model is, the easier it will be to build and consume!
In the B2C example, the model is used to make predictions every month. The prediction point is the first day of each month and on that date the model predicts the probability that each customer in the population of interest (those who had placed an order in the preceding three months) will not place an order in the following three months, and therefore will churn.
In the B2B example, the prediction point is every four weeks, up to 36 weeks prior to the renewal date. This gives one prediction every month for the 9 months before renewal.
Model consumption strategy
Before diving into the data, it is important to have line of sight into how the business will use the churn model. This will impact modeling choices, such as how strictly we need to follow the prediction point and whether we can include features which would be difficult to use in production.
One method of consumption, and a good first objective, is to surface insights in order to reduce churn across the entire customer base. As with most data science projects, it makes sense to begin with exploration. Often a thorough understanding of the problem immediately surfaces potential solutions. A good model will present insights which might, for example, uncover regular churn patterns. Presented to relevant stakeholders, these insights may lead to suggested changes to the product in order to divert customers from those patterns. In this way, model insights can be useful to understanding and addressing churn at an aggregate level. This approach is easier and faster to implement, but likely will have more limited ROI, as it does not provide individual churn predictions for each customer.
Second is operationalizing the model to make new predictions in production. This gives each customer their own churn risk and allows end users to prioritize interventions for those which are more likely to churn. For this to be actionable, concrete and cost-effective churn prevention actions are needed. Can we add customer support to the account? Can we offer a promotion? This is why talking to stakeholders at the beginning is important. It teaches us what interventions are possible to prevent churn.
Data Management
With a firm understanding of the problem, we can begin building our training dataset. The first step is to set our prediction point and sampling strategy.
Prediction point and sampling
The most common mistake at this stage is to accidentally train the model on data from after the prediction point. This leads to look-ahead bias. A model trained on data from after the prediction point will have lower accuracy in production than it did in validation, because it no longer has access to data from the future (relative to the prediction point). This is why the first step is to create the relevant prediction points for each customer. For example, the B2B example uses a prediction point of every 4 weeks leading up to the renewal date, up to 36 weeks (9 months) prior to the renewal date. The SQL code below shows an example of how you can create each row in the dataset using this framing.
In [ ]:

#| code-fold: true
#| code-summary: "Show code"
#| output: false

with weeks as (
    select
        row_number() over (order by seq4()) * 4 as n
    from table(generator(rowcount => 9))
)
select
    r.opportunity_id,
    r.renewal_week,
    dateadd('week', -weeks.n, r.renewal_week) as pred_point,
    weeks.n as weeks_to_renewal
from renewals as r
cross join weeks
If the dataset is large enough, the training dataset can be reduced to one row per customer. This is the recommended approach, as it will make partitioning easier and ensure each customer is equally weighted in the dataset. In this case, we randomly choose a valid prediction point for each customer. Using the B2B example, we would randomly choose one of the 9 months for each customer.
In the B2C example, the prediction point is the start of every month. We chose to keep multiple rows per customer, as the dataset was not large enough to develop confident models without them. When using multiple rows per customer, it is important to either use grouped partitioning (grouping on customers such that all rows from one customer are in the same partition) or Out-of-Time Validation. This prevents leakage across the partitions, where a model can learn a specific customer’s behavior.
Target creation
Now we can pull in our definition of churn to create the target. Remember to use the definition relative to the prediction point. In the B2C example, the target is whether the customer made any purchases in the next quarter.
In [ ]:

#| code-fold: true
#| code-summary: "Show code"
#| output: false

with customers as (
    select
        customer_id,
        min(event_date) as first_purchase
    from events
    group by 1
),
customer_months as (
    select
        c.customer_id,
        dc.date_actual as month_start
    from customers as c
    cross join daily_calendar as dc
    where dc.date_actual = dc.first_day_of_month
        and dc.date_actual > c.first_purchase
),
customer_monthly_purchases as (
    select
        c.customer_id,
        c.month_start,
        count(e.id) as monthly_number_of_purchases
    from customer_months as c
    left join events as e on c.customer_id = e.customer_id
        and c.month_start = date_trunc('month', e.event_date)::date
    where c.month_start < current_date - interval '3 months'
    group by 1, 2
),
base_table as (
    select
        customer_id,
        month_start as pred_point,
        sum(monthly_number_of_purchases) over (
            partition by customer_id
            order by month_start
            rows between 3 preceding and 1 preceding
        ) as number_of_purchases_last_3_months,
        sum(monthly_number_of_purchases) over (
            partition by customer_id
            order by month_start
            rows between current row and 2 following
        ) as number_of_purchases_next_3_months,
    (number_of_purchases_next_3_months = 0)::int as churn
    from customer_monthly_purchases
)
select customer_id, pred_point, churn
from base_table
where number_of_purchases_last_3_months > 0
limit 5;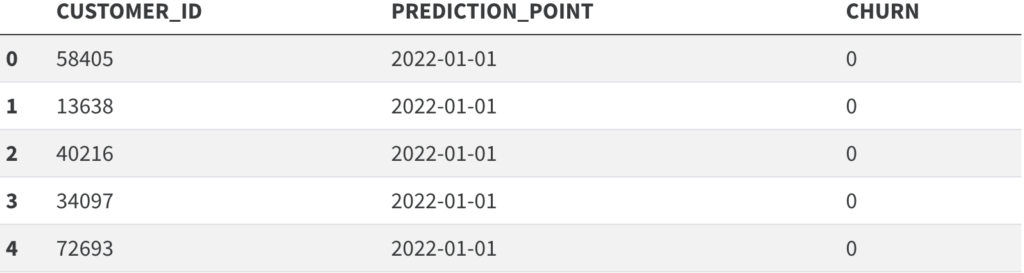
This code generates the primary dataset with CHURN=1 if the customer did not place an order in the upcoming three months, and 0 if they did. Including PREDICTION_POINT in this primary table is important because often the training dataset will be comprised of multiple prediction points. This is useful both to increase the size of the training dataset, as well as to help the model account for seasonality. DataRobot feature engineering will also rely on the PREDICTION_POINT field to avoid look-ahead bias.
The B2B model was set up to predict whether a customer would sign a renewal on their renewal date. Again, creating prediction points was necessary to avoid look-ahead bias just like in the B2C example. In this case, though, predictions would be made more frequently and always in reference to that renewal date, e.g. 4 weeks from renewal or 32 weeks out. This way the model could be trained on how different features impact churn probability at different times in the customer lifecycle.
Data sources
It is not always obvious what data will be predictive of churn, so exploring multiple datasets is worthwhile. Data on product/services consumption are important. Some other datasets to consider are purchase history, customer demographic data, customer surveys, and interactions with customer support. In the B2C example, we used data on customer reviews as well as refunds issued.
One way to uncover valuable insights is to include data on actions controllable by the business. If a promotion or a specific marketing campaign turns out to be predictive of churn or retention, that is a quick action item to share with stakeholders. Just ensure these actions were taken before the prediction point, rather than in response to a perceived churn risk.
Listen to your stakeholders about their beliefs on what drives churn or retention and include that data when it is available. This can go a long way towards building their trust in the model. If your model validates their beliefs, it shows evidence that it is learning relevant behavior. On the contrary, if the model refutes one of their beliefs, this can spur a conversation about it. There might be bad data in your dataset, or maybe the feature you created does not accurately represent what they think is a driver. It could also be proof that their belief is wrong, which can foster a deeper understanding of churn risk at the company. These discussions and further data investigation are the key to finding out why.
At the end of the day, start with whatever data is easily accessible and build models with that. Showing value to the business quickly is more important than exploring every dataset possible.
Feature engineering
Merging all of your disparate data into one table may sound daunting. DataRobot’s automated feature engineering can help in a number of ways. DataRobot feature engineering accelerates data preparation for churn modelling by joining data from disparate datasets, automatically generating a wide variety of features across these datasets, and removing features that have little/no relation to churn. Crucially, it also helps avoid the aforementioned look-ahead bias. DataRobot makes use of time-aware feature engineering to ensure we avoid this.
If you prefer to build the dataset outside of DataRobot, make sure your joins are aware of the prediction point, not just the customer ID. In the B2B example, we made heavy use of window functions to create features over a specific period of time. For example, we can join a usage table once but create multiple feature derivation windows, such as number of projects created in the last 4 weeks, last 12 weeks, etc. The SQL below demonstrates how to do this.
In [ ]:

#| code-fold: true
#| code-summary: "Show code"
#| output: false

with weekly_usage_data as (
       select
              a.account_id,
              date_trunc('week', c.date_actual)::date as week_start,
              sum(u.projects_created) as projects_created
       from accounts as a
       inner join daily_calendar as c on a.customer_since_date <= c.date_actual
              and current_date >= c.date_actual
       left join usage_data as u on a.account_id = u.account_id
              and c.date_actual = u.activity_date
       group by 1, 2
)
select
       account_id,
       week_start,
       sum(projects_created) over (partition by account_id
                                   order by week_start
                                   rows between 12 preceding and 1 preceding) as projects_created_last_12_weeks,
       sum(projects_created) over (partition by account_id
                                   order by week_start
                                   rows between 4 preceding and 1 preceding) as projects_created_last_4_weeks
from weekly_usage_data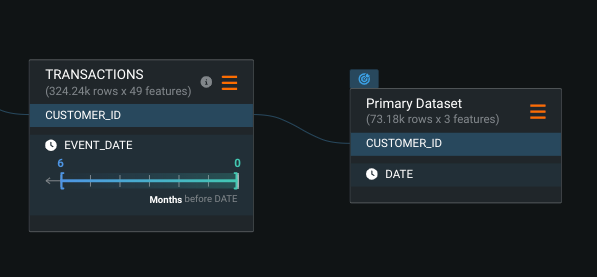
Ultimately you can be as creative as you want. Just make sure your features are interpretable to the business. They will have ownership of making decisions from what the model recommends, so it is important that they understand how the model makes its predictions.
With our problem well-framed and our dataset created, we are in good shape to begin modelling. Look for Part 2 in this 3 part series for a discussion of model training and evaluation.
Explore more AI Accelerators
-
HorizontalObject Classification on Video with DataRobot Visual AI
This AI Accelerator demonstrates how deep learning model trained and deployed with DataRobot platform can be used for object detection on the video stream (detection if person in front of camera wears glasses).
Learn More -
HorizontalPrediction Intervals via Conformal Inference
This AI Accelerator demonstrates various ways for generating prediction intervals for any DataRobot model. The methods presented here are rooted in the area of conformal inference (also known as conformal prediction).
Learn More -
HorizontalReinforcement Learning in DataRobot
In this notebook, we implement a very simple model based on the Q-learning algorithm. This notebook is intended to show a basic form of RL that doesn't require a deep understanding of neural networks or advanced mathematics and how one might deploy such a model in DataRobot.
Learn More -
HorizontalDimensionality Reduction in DataRobot Using t-SNE
t-SNE (t-Distributed Stochastic Neighbor Embedding) is a powerful technique for dimensionality reduction that can effectively visualize high-dimensional data in a lower-dimensional space.
Learn More