

Starter: Predicting Flight Delays
This accelerator aims to assist DataRobot trial users by providing a guided walkthough of the trial experience. DataRobot suggests that you complete the Flight Delays sample use case in the graphical user interface first, and then return to this accelerator.
Request a DemoIn this notebook, you will:
- Create a use case folder.
- Import data from an S3 bucket (this differs from the in-software walkthrough tutorial).
- Perform a data wrangling operation to create the target feature with code (this also differs from the in-software walkthrough tutorial).
- Register the wrangled data set.
- Explore the new data set.
- Create an experiment and allow DataRobot automation to populate it with many modeling pipelines.
- Explore model insights for the best performing model.
- View the modeling pipeline for the best performing model.
- Register a model in the Model Registry.
- Configure a deployment.
- Create a deployment.
- Make predictions using the deployment.
- Review deployment metrics.
Data source
Information on flight delays is made available by the Bureau of Transportation Statistics. DataRobot downloaded data from this website in April 2023 and made minor modifications to prepare it for use in this accelerator.
To narrow down the amount of data involved, the dataset assembled for this use case is limited to January 2023 flights originating in Portland (PDX) and Seattle (SEA) operated by the carriers Alaska Airlines (AS) and United Airlines (UA).
Data contents
There 7671 rows in the training data set with these 15 columns:
| Field | Data Type | Description |
|---|---|---|
| Date | str (MM/DD/YYYY) | The date of the flight. |
| Carrier Code | categorical | The carrier code of the airline (one of AS, UA). |
| Origin Airport | categorical | The three-letter airport code of the origin airport (one of PDX, SEA). |
| Flight Number | numeric | The flight number for the flight (needs to be converted to categorical). |
| Tail Number | categorical | The tail number of the aircraft. |
| Destination Airport | categorical | The three-letter airport code of the destination airport (many variants). |
| Scheduled Departure Time | time (HH:MM) | The 24-hour scheduled departure time of the flight, in the origin airport’s timezone. |
| Take-Off Delay Minutes | numeric | The number of minutes past the scheduled departure time that the flight took off (also known as wheels-up time). |
Setup
Import libraries
The first cell of the notebook imports necessary packages, and sets up the connection to the DataRobot platform. This accelerator uses Use Cases to organize related AI assets into a folder. Use Cases was added to the DataRobot Python package in version 3.2.0.
In [1]:

import datarobot as dr
import matplotlib.pyplot as plt
import numpy as np
import pandas as pd
In [2]:
print(dr.__version__)
3.2.1
In [3]:

# Upgrade datarobot package to at least 3.2.0
# pip install --upgrade datarobot
Connect to DataRobot
Read more about different options for connecting to DataRobot from the Python client.
In [4]:

# Connect to DataRobot when using DataRobot Notebooks
dr.Client()
Out [4]:
<datarobot.rest.RESTClientObject at 0x10e4afeb0>
In [5]:

# Connect to DataRobot when working outside DataRobot Notebooks
# api_key = "YOUR_API_TOKEN"  # Get this from the Developer Tools page in the DataRobot UI
# endpoint = "YOUR_DATAROBOT_BASE_URL"  # eg "https://app.datarobot.com/" This should be the URL you use to access the DataRobot UI

# dr.Client(endpoint="%sapi/v2" % (endpoint), token=api_key)
In [6]:
# or use a config file
# dr.Client(config_path = "/Users/andrea.kropp/datarobot_ee_account_config.yaml")Create a new Use Case
Create a new use case folder to contain the assets that this accelerator will produce. This notebook will create three datasets, one experiment and one deployment inside the use case folder.
In [7]:

# Create a use case folder

flight_delays_use_case = dr.UseCase.create(
    name="Final Flight Delays Walkthrough from Notebook",
    description="Tutorial for understanding end-to-end workflows in DataRobot.",
)

flight_delays_use_case.id
Out [7]:
'6543e9d18115b2f028fe6bd9'Retrieve the data
The data for this use case is provided in DataRobot’s Amazon S3 public datasets bucket. There is a 300 KB CSV file used to train the model and a 31 KB CSV file used for performing a batch scoring job.
You can download the data to inspect it or add it directly to DataRobot’s AI Catalog as shown in this notebook. The datasets can be added to AI Catalog directly from the Amazon S3 bucket.
Download the training data (optional)
Download the scoring data (optional)
Upload data to DataRobot
The datasets can be added to AI Catalog directly from the Amazon S3 bucket. After they are added, associate them with the current Use Case.
In [8]:

training_data = dr.Dataset.upload(
    "https://s3.amazonaws.com/datarobot_public_datasets/ai_accelerators/flight_delays/flight_delays_training.csv"
)
training_data.id
Out [8]:
'6543e9d18115b2f028fe6bdb'
In [9]:

scoring_data = dr.Dataset.upload(
    "https://s3.amazonaws.com/datarobot_public_datasets/ai_accelerators/flight_delays/flight_delays_scoring.csv"
)
scoring_data.id
Out [9]:
'6543ea10134c85fe7808bba3'
In [10]:

# Add the two datasets to the use case

flight_delays_use_case.add(entity=training_data)
flight_delays_use_case.add(entity=scoring_data)
flight_delays_use_case.list_datasets()
Out [10]:
[Dataset(name='flight_delays_scoring.csv', id='6543ea10134c85fe7808bba3'),
Dataset(name='flight_delays_training.csv', id='6543e9d18115b2f028fe6bdb')]Explore and wrangle the data
Access the dataset that has been uploaded to AI Catalog and convert it to a pandas dataframe. Then view the top few rows. Perform a calculation to create a new column. The new column will be used as the target for the binary classifier, so this step is required.
View dataset
In [11]:

# Retrieve the data set locally and convert it to a pandas dataframe
df = dr.Dataset.get(training_data.id).get_as_dataframe()
df.head(10)| Date | Carrier_Code | Origin_Airport | Flight_Number | Tail_Number | Destination_Airport | Scheduled_Departure_Time | Take_Off_Delay_Minutes | |
| 0 | 1/1/23 | UA | SEA | 2090 | N79521 | ORD | 0:29 | 3 |
| 1 | 1/1/23 | AS | SEA | 185 | N408AS | ANC | 0:30 | 75 |
| 2 | 1/1/23 | UA | SEA | 2672 | N67501 | DEN | 5:03 | 3 |
| 3 | 1/1/23 | UA | PDX | 2493 | N39423 | DEN | 5:05 | 8 |
| 4 | 1/1/23 | AS | PDX | 697 | N237AK | SJC | 6:00 | 12 |
| 5 | 1/1/23 | AS | PDX | 371 | N533AS | LAX | 6:00 | -1 |
| 6 | 1/1/23 | AS | SEA | 257 | N926VA | LAX | 6:00 | 9 |
| 7 | 1/1/23 | AS | SEA | 1014 | N260AK | ORD | 6:00 | 15 |
| 8 | 1/1/23 | AS | SEA | 74 | N618AS | SNA | 6:00 | -1 |
| 9 | 1/1/23 | UA | SEA | 1771 | N35271 | ORD | 6:24 | 4 |
In [12]:
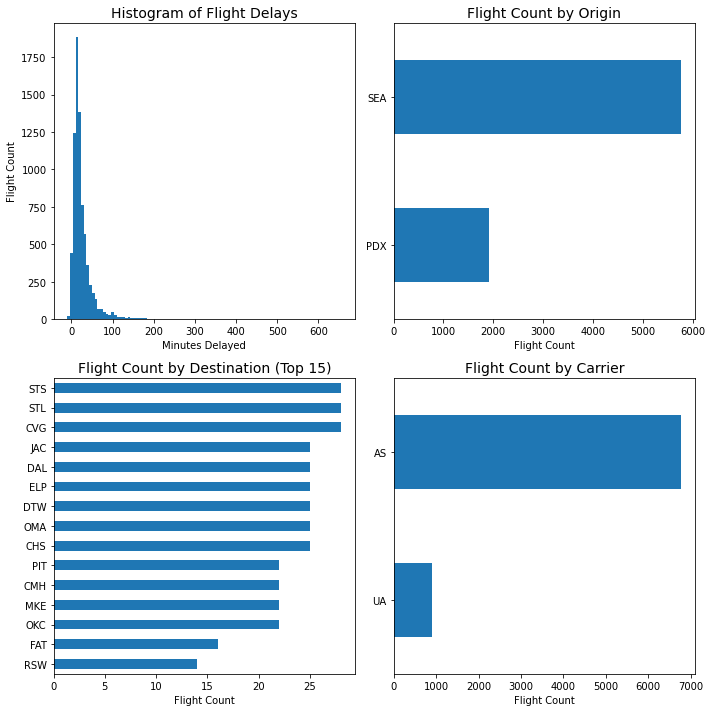
# Explore the data provided with some plots
plt.rcParams["axes.labelsize"] = 10
plt.rcParams["axes.titlesize"] = 14
plt.rcParams["xtick.labelsize"] = 10
plt.rcParams["ytick.labelsize"] = 10
plt.rcParams["figure.titlesize"] = 14
fig, axes = plt.subplots(nrows=2, ncols=2, figsize=(10, 10), tight_layout=True)
plt.subplot(2, 2, 1)
plt.hist(df["Take_Off_Delay_Minutes"], bins=100)
plt.title(
"Histogram of Flight Delays",
)
plt.ylabel("Flight Count")
plt.xlabel("Minutes Delayed")
plt.subplot(2, 2, 2)
df["Origin_Airport"].value_counts().sort_values().plot(kind="barh")
plt.title("Flight Count by Origin")
plt.xlabel("Flight Count")
plt.subplot(2, 2, 3)
df["Destination_Airport"].value_counts().sort_values()[0:15].plot(kind="barh")
plt.title("Flight Count by Destination (Top 15)")
plt.xlabel("Flight Count")
plt.subplot(2, 2, 4)
df["Carrier_Code"].value_counts().sort_values().plot(kind="barh")
plt.title("Flight Count by Carrier")
plt.xlabel("Flight Count")Out [12]:
Text(0.5, 0, 'Flight Count')
Perform one data wrangling operation
The training data contains the flight delay in minutes with the feature name TAKE_OFF_DELAY_MINUTES. Compute a new binary feature to indicate if the delay is greater than 30 minutes named TAKE_OFF_DELAY_GREATER_THAN_30.
In [13]:

# Calculate whether the delay exceeds 30 minutes
df["TAKE_OFF_DELAY_GREATER_THAN_30"] = np.where(df["Take_Off_Delay_Minutes"] > 30, 1, 0)

# Calculate the percentage of all flights delayed by more than 30 minutes
np.mean(df["TAKE_OFF_DELAY_GREATER_THAN_30"])
Out [13]:
0.24172099087353324
In [14]:

# Add the wrangled data to the Use Case; obtain the unique identifier for the dataset

df_final = dr.Dataset.create_from_in_memory_data(
    data_frame=df, use_cases=flight_delays_use_case, fname="flight delays wrangled"
)
df_final.id
Out [14]:
'6543ea4e36f70a91d0700201'
Create an Experiment
To create an experiment project from a dataset, use create_from_dataset().
Start a new project and obtain its ID number for future reference. If you wish, you can open the DataRobot graphical user interface and you’ll see a new Experiment project listed after you execute the next cell.
In [15]:

# Create a new experiment project from a previously registered dataset
# Place the project in the same use case folder

project = dr.Project.create_from_dataset(
    df_final.id,
    project_name="Flight Delays Walkthrough Experiments",
    use_case=flight_delays_use_case,
)
project.id
Out [15]:
'6543ea8335cacd9d5d4703d4'
Start modeling
The project is ready to start modeling. There are numerous configurable settings which are out of scope of this accelerator. Visit the DataRobot documentation to learn more about advanced options, modeling modes, worker counts and selecting an optimization metric.
You can optionally open the DataRobot GUI to see a new experiment listed after you execute the next cell.
In [16]:

# Start modeling. Once you execute this, the initial settings can no longer be changed.
project.analyze_and_model(target="TAKE_OFF_DELAY_GREATER_THAN_30")

# You can optionally open the DataRobot GUI to see the modeling in progress.
project.wait_for_autopilot(timeout=3600)
In progress: 8, queued: 1 (waited: 0s)
In progress: 8, queued: 1 (waited: 1s)
In progress: 8, queued: 1 (waited: 2s)
In progress: 8, queued: 1 (waited: 3s)
In progress: 8, queued: 1 (waited: 4s)
In progress: 8, queued: 1 (waited: 6s)
In progress: 8, queued: 1 (waited: 10s)
In progress: 8, queued: 1 (waited: 18s)
In progress: 8, queued: 1 (waited: 31s)
In progress: 4, queued: 0 (waited: 52s)
In progress: 2, queued: 0 (waited: 73s)
In progress: 2, queued: 0 (waited: 94s)
In progress: 1, queued: 0 (waited: 115s)
In progress: 7, queued: 9 (waited: 136s)
In progress: 8, queued: 8 (waited: 157s)
In progress: 7, queued: 2 (waited: 178s)
In progress: 7, queued: 0 (waited: 199s)
In progress: 2, queued: 0 (waited: 220s)
In progress: 0, queued: 0 (waited: 241s)
In progress: 0, queued: 0 (waited: 262s)
In progress: 1, queued: 0 (waited: 282s)
In progress: 1, queued: 0 (waited: 303s)
In progress: 1, queued: 0 (waited: 324s)
In progress: 1, queued: 0 (waited: 345s)
In progress: 0, queued: 0 (waited: 365s)
In progress: 0, queued: 0 (waited: 386s)
In progress: 0, queued: 0 (waited: 407s)Examine Experiment contents and explore the top model
List all the models that have been created within the project. Then you can learn more about the top performing model.
In [17]:

# Get all the models for the project. The top model for the optimization metric on the validation set is the first one.
models = project.get_models()
models
Out [17]:
[Model('RuleFit Classifier'),
Model('RuleFit Classifier'),
Model('Light Gradient Boosting on ElasticNet Predictions '),
Model('eXtreme Gradient Boosted Trees Classifier with Early Stopping'),
Model('RandomForest Classifier (Gini)'),
Model('Light Gradient Boosted Trees Classifier with Early Stopping'),
Model('Elastic-Net Classifier (mixing alpha=0.5 / Binomial Deviance)'),
Model('Elastic-Net Classifier (L2 / Binomial Deviance)'),
Model('Generalized Additive2 Model'),
Model('Keras Slim Residual Neural Network Classifier using Training Schedule (1 Layer: 64 Units)')]In [18]:
# Retrieve the model object for the top performing model. Select one of the models to examine more closely.
# Note that model comparison is better conducted in the graphical user interface.
top_model = project.get_top_model(metric="LogLoss")
top_model.idOut [18]:
'6543eacc46dd8c49b326ae86'
In [19]:

# Print the LogLoss and AUC for the top model
f"The top model is a {top_model.model_type} with a Log Loss of {top_model.metrics['LogLoss']['crossValidation']}
Out [19]:
'The top model is a RuleFit Classifier with a Log Loss of 0.521166 and an AUC of 0.664088.'
Feature Impact
Learn about the features used in the top performing model and visualize which features are driving model decisions.
In [19]:

# Get Feature Impact for the top model
feature_impact = top_model.get_or_request_feature_impact()

# Save feature impact in a pandas dataframe
fi_df = pd.DataFrame(feature_impact)

fi_df| featureName | impactNormalized | impactUnnormalized | redundantWith | |
|---|---|---|---|---|
| 0 | Date | 1.000000 | 0.023229 | None |
| 1 | Scheduled_Departure_Time | 0.949682 | 0.022060 | None |
| 2 | Flight_Number | 0.591023 | 0.013729 | None |
| 3 | Date (Day of Week) | 0.548815 | 0.012748 | None |
| 4 | Origin_Airport | 0.506295 | 0.011761 | None |
| 5 | Destination_Airport | 0.397192 | 0.009226 | None |
| 6 | Scheduled_Departure_Time (Hour of Day) | 0.260896 | 0.006060 | None |
| 7 | Carrier_Code | 0.036059 | 0.000838 | None |
| 8 | Tail_Number | 0.000000 | 0.000000 | None |
Blueprint
See the full machine leanring pipeline for the top model including preprocessing steps.
In [21]:

# Retrieve the blueprint of the top model
blueprint = dr.Blueprint.get(project.id, top_model.blueprint_id)

print(blueprint.processes)
['One-Hot Encoding', 'Missing Values Imputed', 'Matrix of word-grams occurrences', 'RuleFit Classifier']
Register the model
Register the top model in the Model Registry. This will be possible with future versions of the DataRobot Python package.
Deploy the model
Deploy the model to a DataRobot prediction server.
In [22]:

# The default prediction server is used when making predictions against the deployment, and is a requirement for creating a deployment on DataRobot cloud.
prediction_server = dr.PredictionServer.list()[0]
prediction_server
Out [22]:
PredictionServer(https://mlops.dynamic.orm.datarobot.com)
In [23]:

# Create a new deployment

deployment = dr.Deployment.create_from_learning_model(
    top_model.id,
    label="Flight Delays Deployment",
    description="Deployment from notebook of top model",
    default_prediction_server_id=prediction_server.id,
)

deployment.id
Out [23]:
'6543ec6e6fcffd7022f1cf12'
In [24]:

# Update deployment settings to enable draft tracking

deployment.update_drift_tracking_settings(
    target_drift_enabled=True, feature_drift_enabled=True
)
Make batch predictions
Make predictions using the scoring dataset. There are many options for how to score new data. Read about all your choices for making predictions.
In [35]:

# Option 1: Score an in-memory Pandas DataFrame.

scoring_df = dr.Dataset.get(scoring_data.id).get_as_dataframe()
scoring_df.head(5)
Out [35]:
| Date | Carrier_Code | Origin_Airport | Flight_Number | Tail_Number | Destination_Airport | Scheduled_Departure_Time | |
|---|---|---|---|---|---|---|---|
| 0 | 1/29/23 | UA | SEA | 529 | N27724 | IAH | 5:00 |
| 1 | 1/29/23 | UA | PDX | 2075 | N466UA | IAH | 5:04 |
| 2 | 1/29/23 | UA | SEA | 2672 | N808UA | DEN | 5:15 |
| 3 | 1/29/23 | UA | PDX | 2493 | N463UA | DEN | 5:30 |
| 4 | 1/29/23 | UA | SEA | 1780 | N37536 | SFO | 5:30 |
In [36]:

# The method returns a copy of the job status and the updated DataFrame with the predictions added.
# So your DataFrame will now contain the following extra columns:

job, scoring_df = dr.BatchPredictionJob.score_pandas(deployment.id, scoring_df)

scoring_df.head(5)
Streaming DataFrame as CSV data to DataRobot
Created Batch Prediction job ID 6543edb01cd1acb572c6059c
Waiting for DataRobot to start processing
Job has started processing at DataRobot. Streaming results.Out [36]:
| 0 | 1 | 2 | 3 | 4 | |
| Date | 1/29/23 | 1/29/23 | 1/29/23 | 1/29/23 | 1/29/23 |
| Carrier_Code | UA | UA | UA | UA | UA |
| Origin_Airport | SEA | PDX | SEA | PDX | SEA |
| Flight_Number | 529 | 2075 | 2672 | 2493 | 1780 |
| Tail_Number | N27724 | N466UA | N808UA | N463UA | N37536 |
| Destination_Airport | IAH | IAH | DEN | DEN | SFO |
| Scheduled_Departure_Time | 5:00 | 5:04 | 5:15 | 5:30 | 5:30 |
| TAKE_OFF_DELAY_GREATER_THAN_30_1_PREDICTION | 0.145428 | 0.063791 | 0.093707 | 0.060908 | 0.144848 |
| TAKE_OFF_DELAY_GREATER_THAN_30_0_PREDICTION | 0.854572 | 0.936209 | 0.906293 | 0.939092 | 0.855152 |
| TAKE_OFF_DELAY_GREATER_THAN_30_PREDICTION | 0 | 0 | 0 | 0 | 0 |
| THRESHOLD | 0.5 | 0.5 | 0.5 | 0.5 | 0.5 |
| POSITIVE_CLASS | 1 | 1 | 1 | 1 | 1 |
| DEPLOYMENT_APPROVAL_STATUS | APPROVED | APPROVED | APPROVED | APPROVED | APPROVED |
Review deployment metrics
Having scored some data, you can now view the monitoring metrics associated with the deployment. Learn about all monitoring metrics associated with the Deployment.
In [ ]:
# Wait a few seconds to be sure that monitoring metrics will be available when requested
import time

time.sleep(15)  # Sleep for 15 seconds
In [38]:
# Returns the total number of predictions made
from datarobot.enums import SERVICE_STAT_METRIC
service_stats = deployment.get_service_stats()
service_stats[SERVICE_STAT_METRIC.TOTAL_PREDICTIONS]Out [38]:
1648In [39]:
# Returns the drift in the target feature
from datarobot.enums import DATA_DRIFT_METRIC
target_drift = deployment.get_target_drift()
target_drift.drift_scoreOut [39]:
0.41781727459845186
In [40]:

# Retrieves drift metrics for features other than the target

feature_drift_data = deployment.get_feature_drift()

feature_drift_data
Out [40]:
[FeatureDrift(6543eacc46dd8c49b326ae86 | Flight_Number | 2023-10-26 19:00:00+00:00 - 2023-11-02 19:00:00+00:00),
FeatureDrift(6543eacc46dd8c49b326ae86 | Date (Day of Week) | 2023-10-26 19:00:00+00:00 - 2023-11-02 19:00:00+00:00),
FeatureDrift(6543eacc46dd8c49b326ae86 | Origin_Airport | 2023-10-26 19:00:00+00:00 - 2023-11-02 19:00:00+00:00),
FeatureDrift(6543eacc46dd8c49b326ae86 | Destination_Airport | 2023-10-26 19:00:00+00:00 - 2023-11-02 19:00:00+00:00),
FeatureDrift(6543eacc46dd8c49b326ae86 | Scheduled_Departure_Time (Hour of Day) | 2023-10-26 19:00:00+00:00 - 2023-11-02 19:00:00+00:00),
FeatureDrift(6543eacc46dd8c49b326ae86 | Carrier_Code | 2023-10-26 19:00:00+00:00 - 2023-11-02 19:00:00+00:00),
FeatureDrift(6543eacc46dd8c49b326ae86 | Tail_Number | 2023-10-26 19:00:00+00:00 - 2023-11-02 19:00:00+00:00)]In [41]:
# View first feature name and drift
feature_drift = feature_drift_data[1]
f"The feature {feature_drift.name} has drift by {feature_drift.drift_score}"Out [41]:
'The feature Date (Day of Week) has drift by 3.176396672912841'Get Started with Predicting Flight Delays

Explore more AI Accelerators
-
HorizontalObject Classification on Video with DataRobot Visual AI
This AI Accelerator demonstrates how deep learning model trained and deployed with DataRobot platform can be used for object detection on the video stream (detection if person in front of camera wears glasses).
Learn More -
HorizontalPrediction Intervals via Conformal Inference
This AI Accelerator demonstrates various ways for generating prediction intervals for any DataRobot model. The methods presented here are rooted in the area of conformal inference (also known as conformal prediction).
Learn More -
HorizontalReinforcement Learning in DataRobot
In this notebook, we implement a very simple model based on the Q-learning algorithm. This notebook is intended to show a basic form of RL that doesn't require a deep understanding of neural networks or advanced mathematics and how one might deploy such a model in DataRobot.
Learn More -
HorizontalDimensionality Reduction in DataRobot Using t-SNE
t-SNE (t-Distributed Stochastic Neighbor Embedding) is a powerful technique for dimensionality reduction that can effectively visualize high-dimensional data in a lower-dimensional space.
Learn More