Improve Model Performance with DataRobot Sliced Insights
There are countless metrics that help data scientists better understand model performance. But model accuracy metrics and diagnostic charts, despite their usefulness, are all aggregations — they can obscure critical information about situations in which a model might not perform as expected. We might build a model that has a high overall accuracy, but unknowingly underperforms in specific scenarios, akin to how a vinyl record may appear whole, but has scratches that are impossible to discover until you play a specific portion of the record.
Any person who uses models — from data scientists to executives — may need more details to decide whether a model is truly ready for production and, if it’s not, how to improve it. These insights may lie within specific segments of your modeling data.
Why Model Segmentation Matters
In many cases, building separate models for different segments of the data will yield better overall model performance than the “one model to rule them all” approach.
Let’s say that you are forecasting revenue for your business. You have two main business units: an Enterprise/B2B unit and a Consumer/B2C unit. You might start by building a single model to forecast overall revenue. But when you measure your forecast quality, you may find that it’s not as good as your team needs it to be. In that situation, building a model for your B2B unit and a separate model for your B2C unit will likely improve the performance of both.
By splitting a model up into smaller, more specific models trained on subgroups of our data, we can develop more specific insights, tailor the model to that distinct group (population, SKU, etc.), and ultimately improve the model’s performance.
This is particularly true if:
- Your data has natural clusters — like your separate B2B and B2C units.
- You have groupings that are imbalanced in the dataset. Larger groups in the data can dominate small ones and a model with high overall accuracy might be masking lower performance for subgroups. If your B2B business makes up 80% of your revenue, your “one model to rule them all” approach may be wildly off for your B2C business, but this fact gets hidden by the relative size of your B2B business.
But how far do you go down this path? Is it helpful to further split the B2B business by each of 20 different channels or product lines? Knowing that a single overall accuracy metric for your entire dataset might hide important information, is there an easy way to know which subgroups are most important, or which subgroups are suffering from poor performance? What about the insights – are the same factors driving sales in both the B2B and B2C businesses, or are there differences between those segments? To guide these decisions, we need to quickly understand model insights for different segments of our data — insights related to both performance and model explainability. DataRobot Sliced Insights make that easy.
DataRobot Sliced Insights, now available in the DataRobot AI Platform, allow users to examine model performance on specific subsets of their data. Users can quickly define segments of interest in their data, called Slices, and evaluate performance on those segments. They can also quickly generate related insights and share them with stakeholders.
How to Generate Sliced Insights
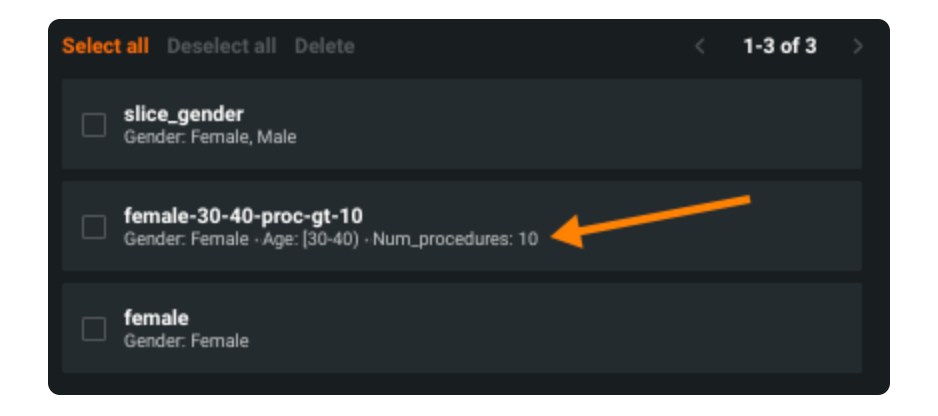
Sliced Insights can be generated entirely in the UI — no code required. First, define a Slice based on up to three Filters: numeric or categorical features that define a segment of interest. By layering multiple Filters, users can define custom groups that are of interest to them. For instance, if I’m evaluating a hospital readmissions model, I could define a custom Slice based on gender, age range, the number of procedures a patient has had, or any combination thereof.
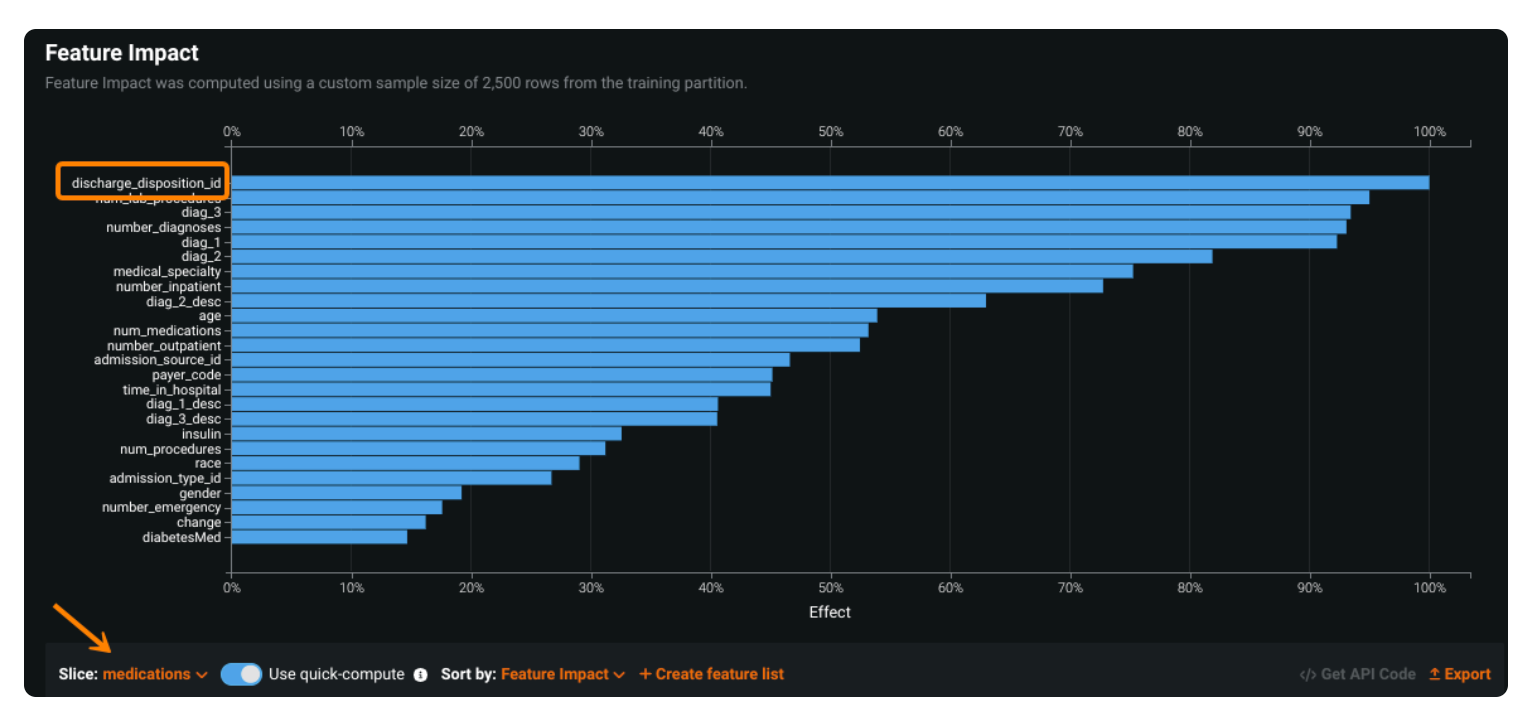
After defining a Slice, users generate Sliced Insights by applying that Slice to the primary performance and explainability tools within DataRobot: Feature Effects, Feature Impact, Lift Chart, Residuals, and the ROC Curve.
This process is frequently iterative. As a data scientist, I might start by defining Slices for key segments of my data — for example, patients who were admitted for a week or longer versus those who stayed only a day or two.
From there, I can dig deeper by adding more Filters. In a meeting, my leadership may ask me about the impact of preexisting conditions. Now, in a couple of clicks, I can see the effect this has on my model performance and related insights. Toggling back and forth between Slices leads to new and different Sliced Insights. For more in-depth information on configuring and using Slices, visit the documentation page.
Case Study: Hospital No-Shows
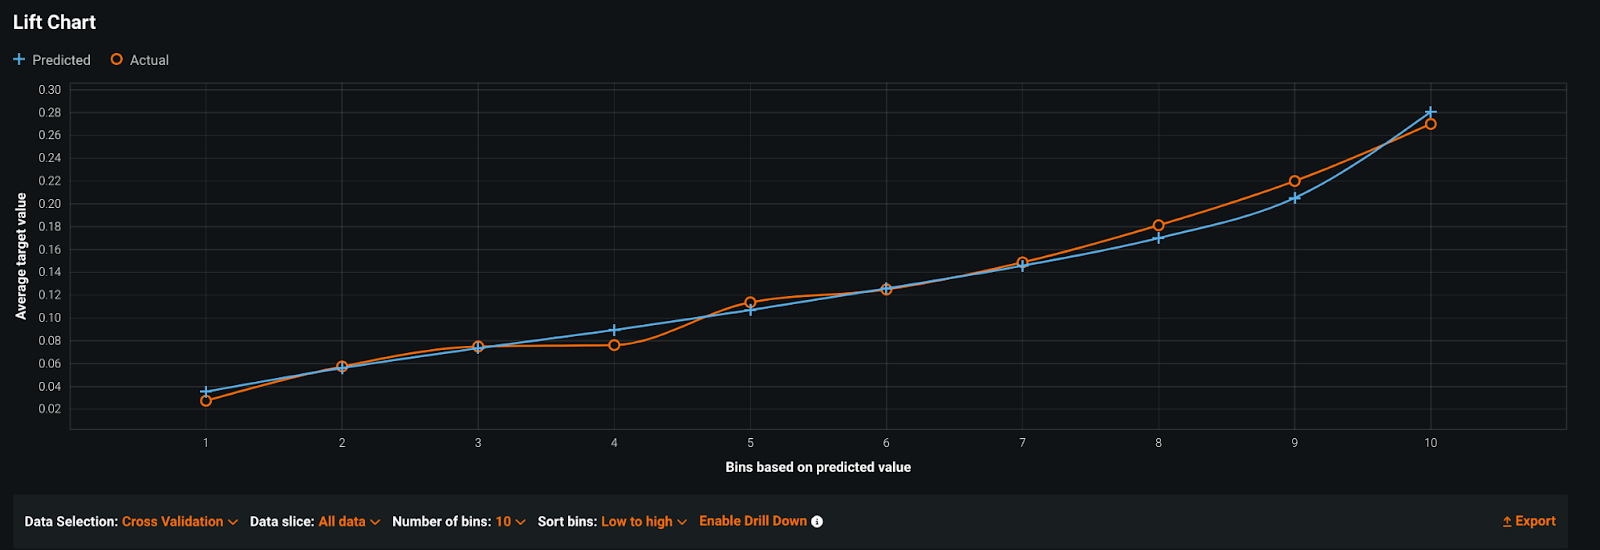
I was recently working with a hospital system that had built a patient no-show model. The performance looked pretty accurate: the model distinguished the patients at lowest risk for no-show from those at higher-risk, and it looked well-calibrated (the predicted and actual lines closely follow one another). Still, they wanted to be sure it would drive value for their end-user teams when they rolled it out.
The team believed that there would be very different behavioral patterns between departments. They had a few large departments (Internal Medicine, Family Medicine) and a long tail of smaller ones (Oncology, Gastroenterology, Neurology, Transplant). Some departments had a high rate of no-shows (up to 20%), whereas others rarely had no-shows at all (<5%).
They wanted to know whether they should be building a model for each department or if one model for all departments would be good enough.
Using Sliced Insights, it quickly became clear that building one model for all departments was the wrong choice. Because of the class imbalance in the data, the model fit the large departments well and had a high overall accuracy that obscured poor performance in small departments.
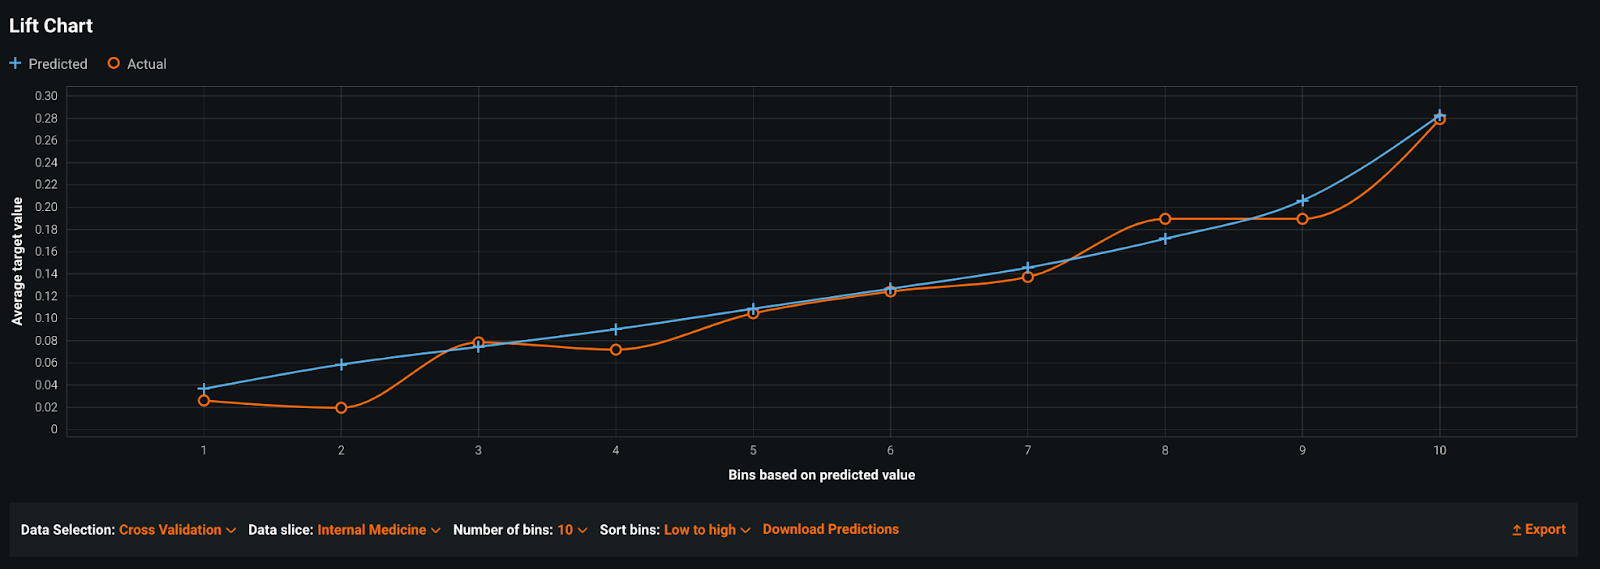
Slice: Internal Medicine
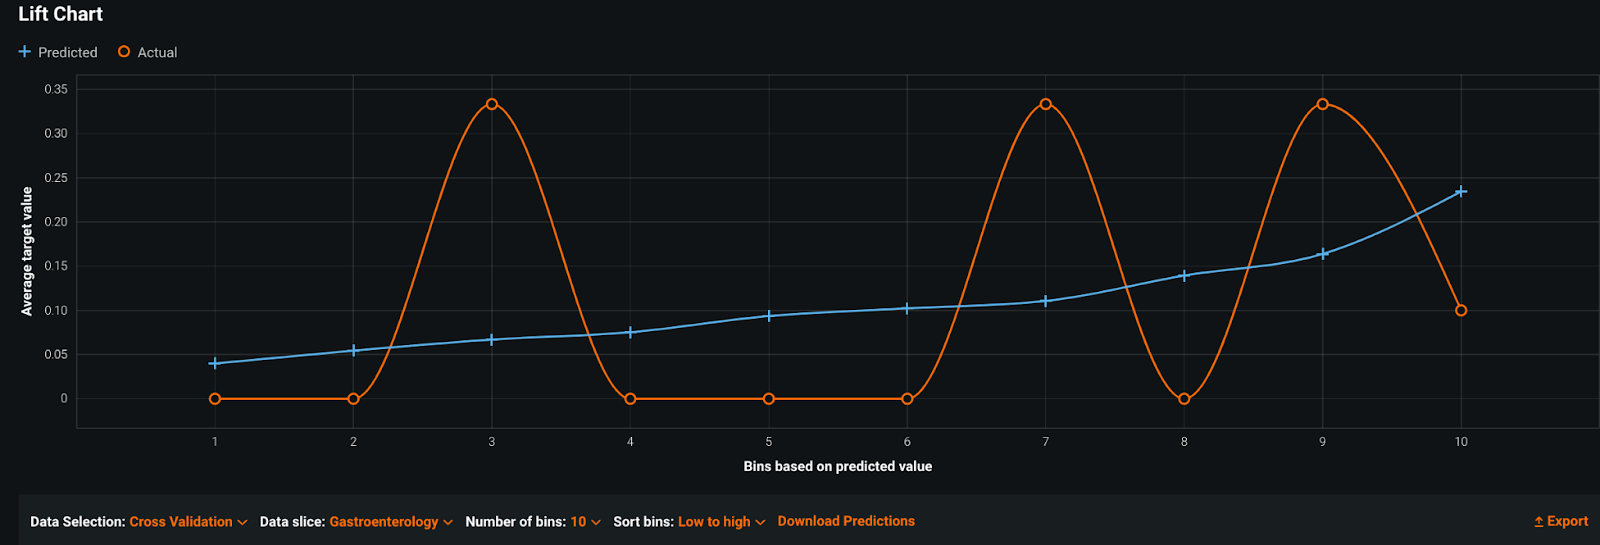
Slice: Gastroenterology
As a result, the team chose to limit the scope of their “general” model to only the departments where they had the most data and where the model added value. For smaller departments, the team used domain expertise to cluster departments based on the types of patients they saw, then trained a model for each cluster. Sliced Insights guided this medical team to build the right set of groups and models for their specific use case, so that each department could realize value.
Sliced Insights for Better Model Segmentation
Sliced Insights help users evaluate the performance of their models at a deeper level than by looking at overall metrics. A model that meets overall accuracy requirements might consistently fail for important segments of the data, such as for underrepresented demographic groups or smaller business units. By defining Slices and evaluating model insights in relation to those Slices, users can more easily determine if model segmentation is necessary or not, quickly surface these insights to communicate better with stakeholders, and, ultimately, help organizations make more informed decisions about how and when a model should be applied.
Get Started Today.