No-Code AI Apps: Time Series What-If Scenarios
The last few years have been plagued with uncertainty, making it difficult to navigate everyday life, let alone plan and make thoughtful decisions for a business. When facing unprecedented challenges, it’s clearer than ever that while the predictions from your AI models are important, the insights we gather and leverage from them to inform the decisions we make are even more so. With DataRobot’s No-Code AI Apps, harnessing your insights to plan, make decisions, and prepare for anything that might come your way is easier than ever, especially thanks to our new Time Series What-If Scenarios.
Introducing Time Series What-If Scenarios
Time Series What-if Scenarios allow your business to simulate and explore scenarios to see how changing feature variables— such as the number of employees working at a certain store location, exploring alternative transportation modes to mitigate potential supply chain disruptions, or changing the timing of a marketing promotion—can vary the outcomes your business cares about most. Could increasing the number of employees on a given day working at a certain location immensely impact sales? How would a new wave of a virus impact ER staff allocation? How will the price of oil impact trucking demand? Gaining insight into possible scenarios that can affect your bottom line, built upon your deployed AI models, allows you to make better decisions for the future of your business that you know you can trust.
Time Series What-If Scenarios can be built with either single or multi-series time series projects. Single series means for one entity over time, and multiseries means for multiple entities, such as national conglomerates’ store locations. With the new Time Series What-If Scenario capability, you can create and save scenarios by changing the variables within your known-in-advance features and comparing them against each other, and/or against the actual, or base, scenario to see what changes would be most impactful to the business. And you can take it a step further by comparing scenarios against other scenarios you build, not just against the actual. With the ability to build up to ten scenarios in one easily digestible view, digging into hypothetical scenarios can quickly help you make the decisions that matter most.
Known-in-advance features are quite literally those that are known in advance of your forecast—like store size, number of employees working on a given day, holiday events such as Christmas where annually the date does not change, and so on. By allowing users to build and explore scenarios by adjusting these features, they can test out various outcomes. For example, you may want to see the relationship between sales when you double your number of employees at a particular store against your numbers for how you typically staff that store. Testing these kinds of scenarios allows you to see where you can make improvements or changes to drive success for your business.
Solve Real Problems
Let’s apply this to a real-life, common scenario. Let’s say that we work for a company with physical retail stores located all over the United States, and we want to forecast sales for multiple store locations. Then let’s take it a step further by altering the known-in-advance features for these dates so we can see how changes to them actually affect profit. This means our project today is a multi-series, time series project with a target of “sales”.
Setting Up Your App
When you create an application from your deployed time series model, you will see a build mode and a go-to app mode. Build mode allows us to customize and configure for the end user, but first, we want to upload predictions for the application to work off of, on top of the data used to train our deployed model.
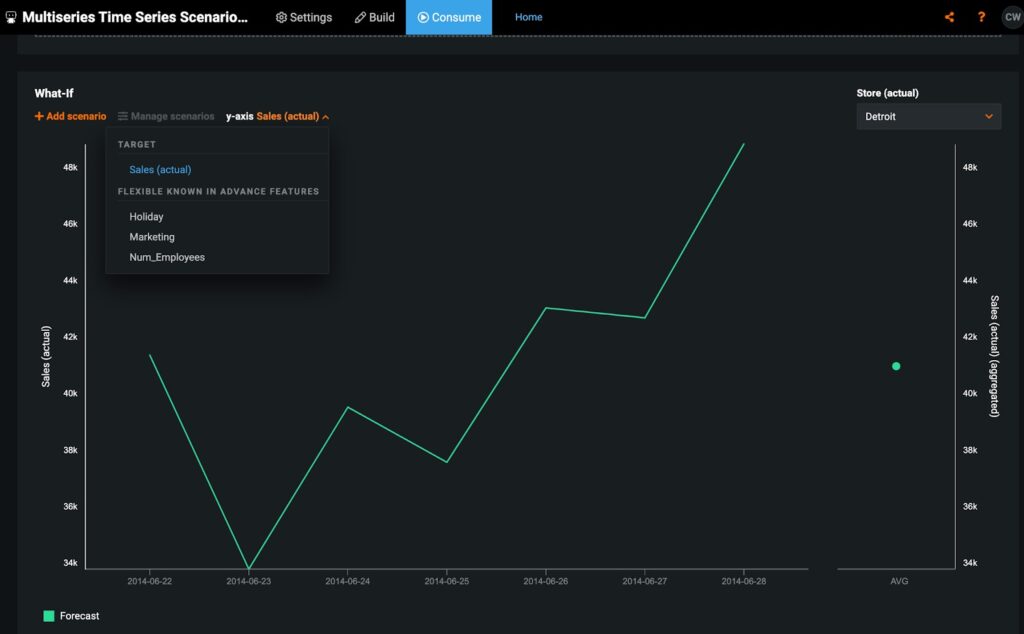
When you upload prediction files, the forecast is shown in green and at the top of the chart. You can see that the y-axis is the target—sales—which we set way back at the start of our project when we first uploaded our dataset into DataRobot. You will also see your known-in-advance features in the image example below. You can see they are: holiday, marketing, and number of employees. On the right hand side, there is the ability to switch between store locations and to create and compare graphs for different locations, adjusting the same features.
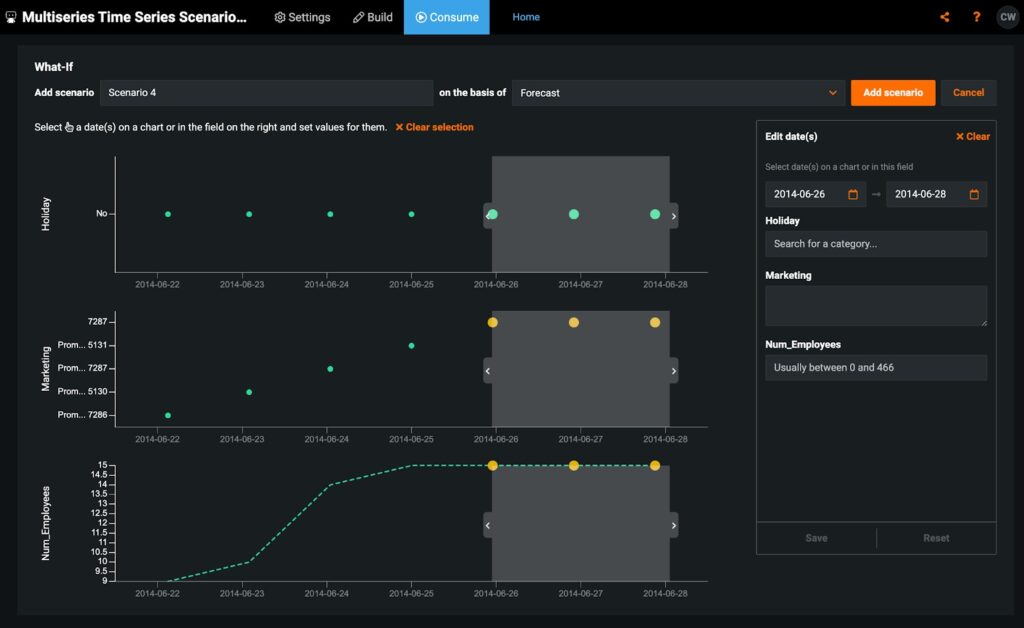
From here, simply hit “Add Scenario” on the right hand side, and begin selecting what features and values you want to adjust. You can choose one date or a batch of dates. Edited feature values will be shown in yellow, as depicted below.
Turn Insights Into Actions
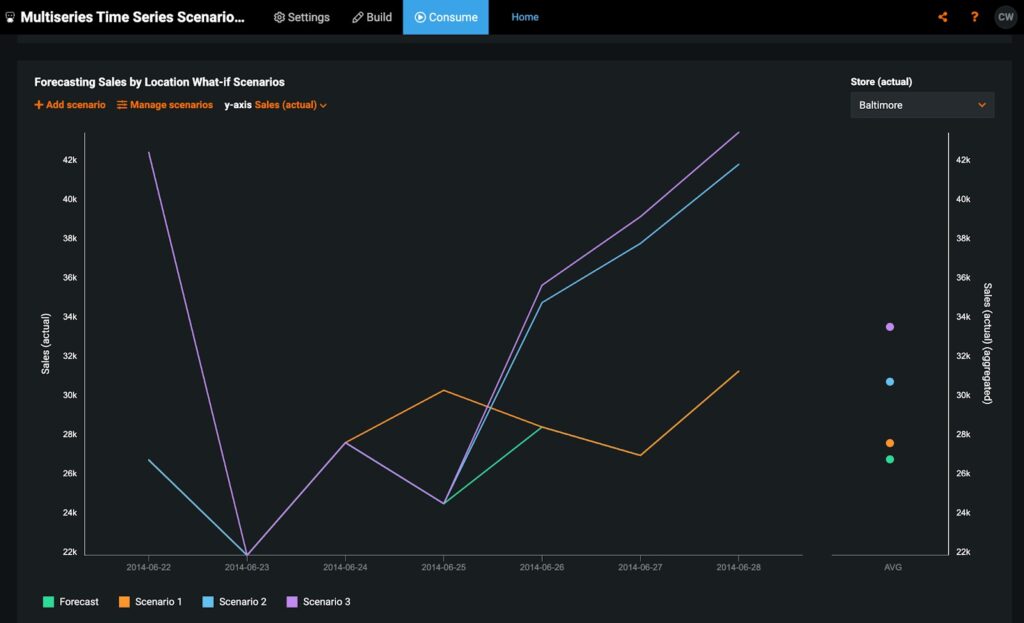
In this use case, we can see that increasing our staffing makes a huge difference in sales for that week at the Baltimore location, even without a promo code or a holiday happening in the same timeframe. Add up to ten scenarios on a given chart, and if it’s a multiseries problem, ten scenarios per series feature (e.g., ten scenarios for Baltimore, ten scenarios for Columbus, and so on). This means I could continue to run different scenarios for all of my different locations and see if increasing staffing makes a considerable difference everywhere or just in Baltimore.
Create, compare, and explore what changes or new strategies would have the most impact on your business. From there, you can easily share your insights with anyone, since an end-user does not need to have a DataRobot account to consume or create their own predictions in the app.
What will you discover?
Interested in Learning More?
Watch the recording from our 2022 AI Experience, featuring a demo by the author.
Get Started Today.