Data scientists have used the DataRobot AI Platform to build time series models for several years. Recently, new forecasting features and an improved integration with Google BigQuery have empowered data scientists to build models with greater speed, accuracy, and confidence. This alignment between DataRobot and Google BigQuery helps organizations more quickly discover impactful business insights.
Forecasting is an important part of making decisions every single day. Workers estimate how long it will take to get to and from work, then arrange their day around that forecast. People consume weather forecasts and decide whether to grab an umbrella or skip that hike. On a personal level, you are generating and consuming forecasts every day in order to make better decisions.
It’s the same for organizations. Forecasting demand, turnover, and cash flow are critical to keeping the lights on. The easier it is to build a reliable forecast, the better your organization’s chances are of succeeding. However, tedious and redundant tasks in exploratory data analysis, model development, and model deployment can stretch the time to value of your machine learning projects. Real-world complexity, scale, and siloed processes among teams can also add challenges to your forecasting.
The DataRobot platform continues to enhance its differentiating time series modeling capabilities. It takes something that’s hard to do but important to get right — forecasting — and supercharges data scientists. With automated feature engineering, automated model development, and more explainable forecasts, data scientists can build more models with more accuracy, speed, and confidence.
When used in conjunction with Google BigQuery, DataRobot takes an impressive set of tools and scales them to handle some of the biggest problems facing business and organizations today. Earlier this month, DataRobot achieved the Google Cloud Ready – BigQuery Designation from Google Cloud. This designation gives our mutual customers an additional level of confidence that the DataRobot AI Platform works seamlessly with BigQuery to generate even more intelligent business solutions.

To understand how DataRobot AI Platform and Big Query can align, let’s explore how DataRobot AI Platform Time Series capabilities help enterprises with three specific areas: segmented modeling, clustering, and explainability.
Flexible BigQuery Data Ingestion to Fuel Time Series Forecasting
Forecasting the future is difficult. Ask anyone who has attempted to “game the stock market” or “buy crypto at the right time.” Even meteorologists struggle to forecast the weather accurately. That’s not because people aren’t intelligent. That’s because forecasting is extremely challenging.
As data scientists might put it, adding a time component to any data science problem makes things significantly harder. But this is important to get right: your organization needs to forecast revenue to make decisions about how many employees it can hire. Hospitals need to forecast occupancy to understand if they have enough room for patients. Manufacturers have a vested interest in forecasting demand so they can fulfill orders.
Getting forecasts right matters. That’s why DataRobot has invested years building time series capabilities like calendar functionality and automated feature derivation that empowers its users to build forecasts quickly and confidently. By integrating with Google BigQuery, these time series capabilities can be fueled by massive datasets.
There are two options to integrate Google BigQuery data and the DataRobot platform. Data scientists can leverage their SQL skills to join their own datasets with Google BigQuery publicly available data. Less technical users can use DataRobot Google BigQuery integration to effortlessly select data stored in Google BigQuery to kick off forecasting models.
Scale Predictions with Segmented Modeling
When data scientists are introduced to forecasting, they learn terms like “trend” and “seasonality.” They fit linear models or learn about the ARIMA model as a “gold standard.” Even today, these are powerful pieces of many forecasting models. But in our fast-paced world where our models have to adapt quickly, data scientists and their stakeholders need more — more feature engineering, more data, and more models.
For example, retailers around the U.S. recognize the importance of inflation on the bottom line. They also understand that the impact of inflation will probably vary from store to store. That is: if you have a store in Baltimore and a store in Columbus, inflation might affect your Baltimore store’s bottom line differently than your Columbus store’s bottom line.
If the retailer has dozens of stores, data scientists will not have weeks to build a separate revenue forecast for each store and still deliver timely insights to the business. Gathering the data, cleaning it, splitting it, building models, and evaluating them for each store is time-consuming. It’s also a manual process, increasing the chance of making a mistake. That doesn’t include the challenges of deploying multiple models, generating predictions, taking actions based on predictions, and monitoring models to make sure they’re still accurate enough to rely on as situations change.
The DataRobot platform’s segmented modeling feature offers data scientists the ability to build multiple forecasting models simultaneously. This takes the redundant, time-consuming work of creating a model for each store, SKU, or category, and reduces that work to a handful of clicks. Segmented modeling in DataRobot empowers our data scientists to build, evaluate, and compare many more models than they could manually.
With segmented modeling, DataRobot creates multiple projects “under the hood.” Each model is specific to its own data — that is, your Columbus store forecast is built on Columbus-specific data and your Baltimore store forecast is built on Baltimore-specific data. Your retail team benefits by having forecasts tailored to the outcome you want to forecast, rather than assuming that the effect of inflation is going to be the same across all of your stores.
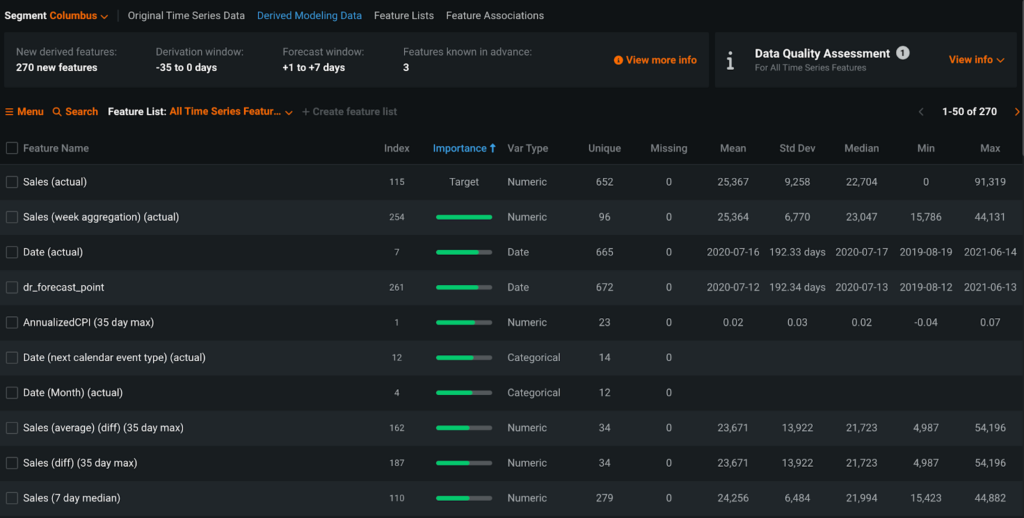
The benefits of segmented modeling go beyond the actual model-building process. When you bring your data in — whether it’s via Google BigQuery or your on-premises database — the DataRobot platform’s time series capabilities include advanced automated feature engineering. This applies to segmented models, too. The retail models for Columbus and Baltimore will have features engineered specifically from Columbus-specific and Baltimore-specific data. If you’re working with even a handful of stores, this feature engineering process can be time-consuming.
The time-saving benefits of segmented modeling also extend to deployments. Rather than manually deploying each model separately, you can deploy each model in a couple of clicks at one time. This helps to scale the impact of each data scientist’s time and shortens the time to get models into production.
Enable Granular Forecasts with Clustering
As we’ve described segmented modeling so far, users define their own segments, or groups of series, to model together. If you have 50,000 different SKUs, you can build a distinct forecast for each SKU. You can also manually group certain SKUs together into segments based on their retail category, then build one forecast for each segment.
But sometimes you don’t want to rely on human intuition to define segments. Maybe it’s time-consuming. Maybe you don’t have a great idea as to how segments should be defined. This is where clustering comes in.
Clustering, or defining groups of similar items, is a frequently used tool in a data scientist’s toolkit. Adding a time component makes clustering significantly more difficult. Clustering time series requires you to group entire series of data, not individual observations. The way we define distance and measure “similarity” in clusters gets more complicated.
The DataRobot platform offers the unique ability to cluster time series into groups. As a user, you can pass in your data with multiple series, specify how many clusters you want, and the DataRobot platform will apply time series clustering techniques to generate clusters for you.
For example, suppose you have 50,000 SKUs. The demand for some SKUs follows similar patterns. For example, bathing suits and sunscreen are probably bought a lot during warmer seasons and less frequently in colder or wetter seasons. If humans are defining segments, an analyst might put bathing suits into a “clothing” segment and sunscreen into a “lotion” segment. Using the DataRobot platform to automatically cluster similar SKUs together, the platform can pick up on these similarities and place bathing suits and sunscreen into the same cluster. With the DataRobot platform, clustering happens at scale. Grouping 50,000 SKUs into clusters is no problem.
Clustering time series in and of itself generates a lot of value for organizations. Understanding SKUs with similar buying patterns, for example, can help your marketing team understand what types of products should be marketed together.
Within the DataRobot AI Platform, there’s an additional benefit to clustering time series: these clusters can be used to define segments for segmented modeling. This means DataRobot AI gives you the ability to build segmented models based on cluster-defined segments or based on human-defined segments.
Understanding Forecasts Through Explainability
As experienced data scientists, we understand that modeling is only part of our work. But if we can’t communicate insights to others, our models aren’t as useful as they could be. It’s also important to be able to trust the model. We want to avoid that “black box AI” where it’s unclear why certain decisions were made. If we’re building forecasts that might affect certain groups of people, as data scientists we need to know the limitations and potential biases in our model.
The DataRobot AI Platform understands this need and, as a result, has embedded explainability across the platform. For your forecasting models, you’re able to understand how your model is performing at a global level, how your model performs for specific time periods of interest, what features are most important to the model as a whole, and even what features are most important to individual predictions.
In conversations with business stakeholders or the C-suite, it’s helpful to have quick summaries of model performance, like accuracy, R-squared, or mean squared error. In time series modeling, though, it’s critical to understand how that performance changes over time. If your model is 99% accurate but regularly gets your biggest sales cycles wrong, it might not actually be a good model for your business purposes.
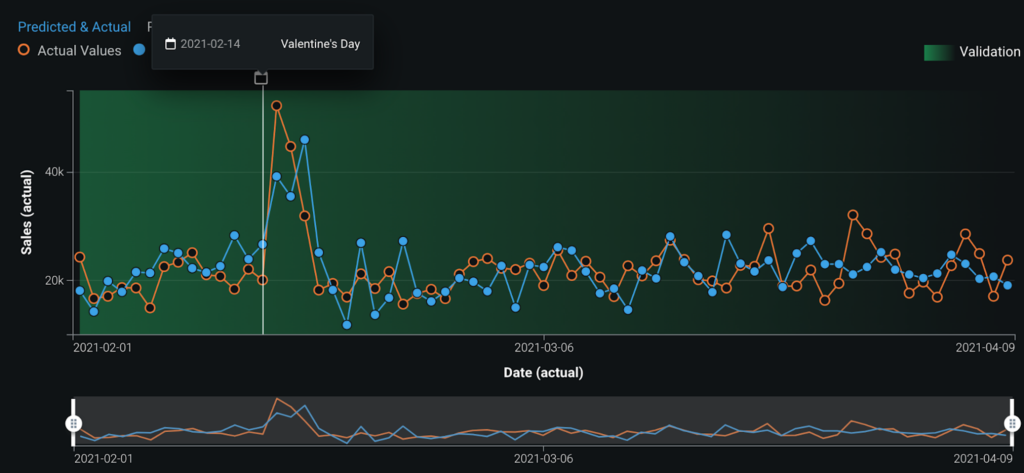
The DataRobot Accuracy Over Time chart shows a clear picture of how a model’s performance changes over time. You can easily spot “big misses” where predictions don’t line up with the actual values. You can also tie this back to calendar events. In a retail context, holidays are often important drivers of sales behavior. We can easily see if gaps tend to align with holidays. If this is the case, this can be helpful information about how to improve your models — for example, through feature engineering — and when our models are most reliable. The DataRobot platform can automatically engineer features based on holidays and other calendar events.
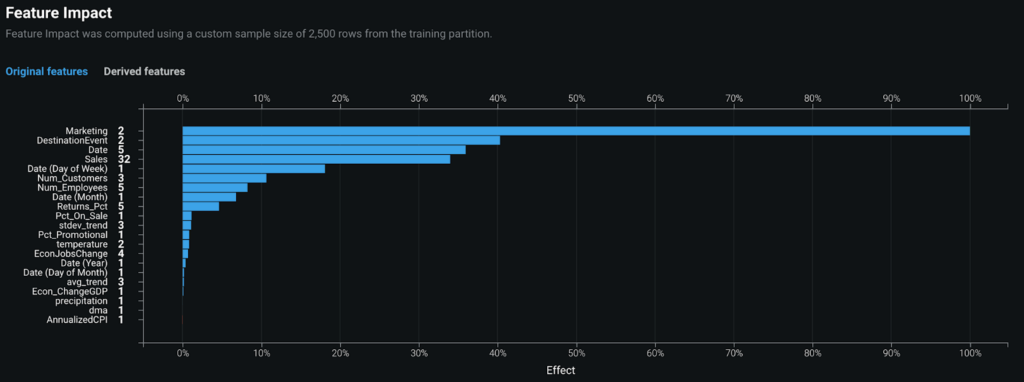
To go deeper, you might ask, “Which inputs have the biggest impact on our model’s predictions?” The DataRobot Feature Impact tab communicates exactly which inputs have the biggest impact on model predictions, ranking each of the input features by how much they globally contributed to predictions. Recall that DataRobot automates the feature engineering process for you. When examining the effect of various features, you can see both the original features (i.e., pre-feature engineering) and the derived features that DataRobot created. These insights give you more clarity on model behavior and what drives the outcome you’re trying to forecast.
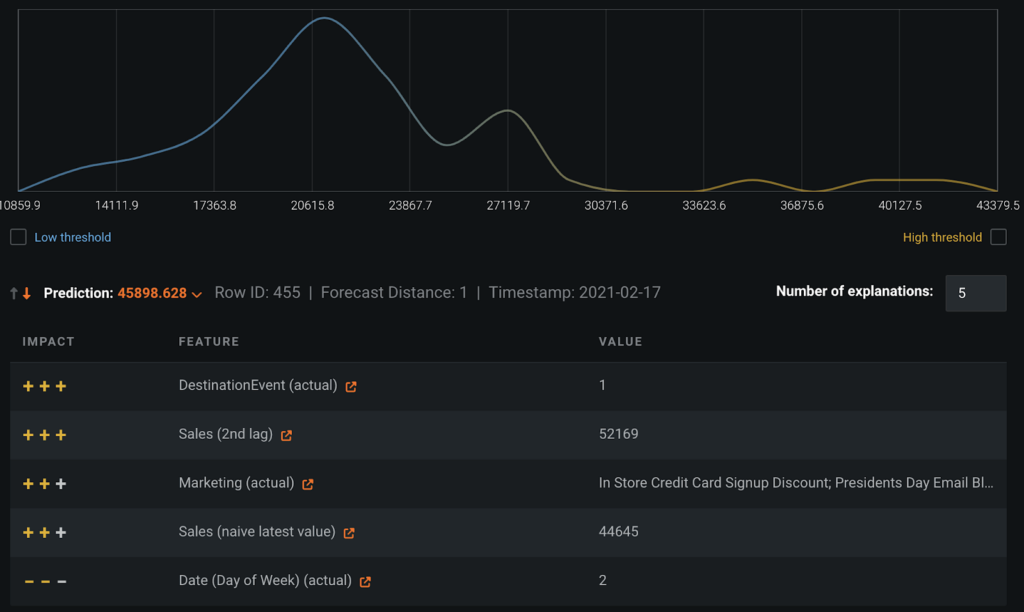
You can go even deeper. For each prediction, you can quantify the impact of features on that individual prediction using DataRobot Prediction Explanations. Rather than seeing an outlier that calls your model into question, you can explore unexpectedly high and low values to understand why that prediction is what it is. In this example, the model has estimated that a given store will have about $46,000 in sales on a given day. The Prediction Explanations tab communicates that the main features influencing this prediction are:
- Is there an event that day?
- What were sales over the last few days?
- There’s an open text feature, Marketing, that DataRobot automatically engineered.
- What is the day of the week?
You can see that this particular sales value for this particular store was influenced upward by all of the variables, except for Day of Week, which influenced this prediction downward. Manually doing this type of investigation takes a lot of time; the Prediction Explanations here helps to dramatically speed up the investigation of predictions. DataRobot Prediction Explanations are driven by the proprietary DataRobot XEMP (eXemplar-based Explanations of Model Predictions) method.
This scratches the surface on what explainability charts and tools are available.
Start Aligning Google BigQuery and DataRobot
You can start by pulling data from Google BigQuery and leveraging the immense scale of data that BigQuery can handle. This includes both data you’ve put into BigQuery and Google BigQuery public datasets that you want to leverage, like weather data or Google Search Trends data. Then, you can build forecasting models in the DataRobot platform on these large datasets and make sure you’re confident in the performance and predictions of your models.
When it’s time to put these into production, the DataRobot platform APIs empower you to generate model predictions and directly export them back into BigQuery. From there, you’re able to use your predictions in BigQuery however you see fit, like displaying your forecasts in a Looker dashboard.
To leverage DataRobot and Google BigQuery together, start by setting up your connection between BigQuery and DataRobot.
Related posts
See other posts in AI PartnersAI adoption in supply chains isn’t about chasing trends. Learn the strategic framework that’s helping leaders build real, lasting impact. Read the full post.
Learn how to build and scale agentic AI with NVIDIA and DataRobot. Streamline development, optimize workflows, and deploy AI faster with a production-ready AI stack.
What is an AI gateway? And why does your enterprise need one? Discover how it keeps Agentic AI scalable, secure, and cost-efficient. Read the full blog.
Related posts
See other posts in AI PartnersGet Started Today.


