Driving AI Success by Engaging a Cross-Functional Team
Enterprises see the most success when AI projects involve cross-functional teams. For true impact, AI projects should involve data scientists, plus line of business owners and IT teams.
By 2025, according to Gartner, chief data officers (CDOs) who establish value stream-based collaboration will significantly outperform their peers in driving cross-functional collaboration and value creation.1 In order to drive this kind of AI success, you need a cross-functional team engaged in the process, invested in outcomes, and feeling a sense of responsibility along the entire lifecycle.
You can build your AI team with people from across your organization, including:
- AI leaders who are responsible for AL/ML strategy and the roadmap within an organization;
- AI builders who are responsible for AI strategy implementation and seek to address business problems using machine learning;
- Business executives who look to solve business problems and drive revenue or reduce costs with AI;
- and IT leaders who are focused on the technology infrastructure of an organization, including the data and analytics infrastructure.
Quite a few complex use cases, such as price forecasting, might require blending tabular data, images, location data, and unstructured text. When you have messy data coming from all over the place, you need a powerful AI platform in order to move forward and implement your AI.
In addition, it’s essential that models comply with regulations and treat customers fairly, making it more important than ever to monitor models in production. It is possible to manage the end-to-end AI lifecycle in one solution. The DataRobot AI Platform makes it possible to engage your cross-functional team to deliver successful AI outcomes, no matter how complex your inputs.
The cost of real estate has been a rollercoaster ride in this challenging macroeconomic climate. In this example, we take a deep dive into how real estate companies can effectively use AI to automate their investment strategies.
We also look at how collaboration is built into the core of the DataRobot AI platform so that your entire team can collaborate from business use case to model deployment. Let’s take a look at an example use case, which showcases the effective use of AI to automate strategic decisions and explores the collaboration capabilities enabled by the DataRobot AI platform.
Improving Productivity with Increased Collaboration
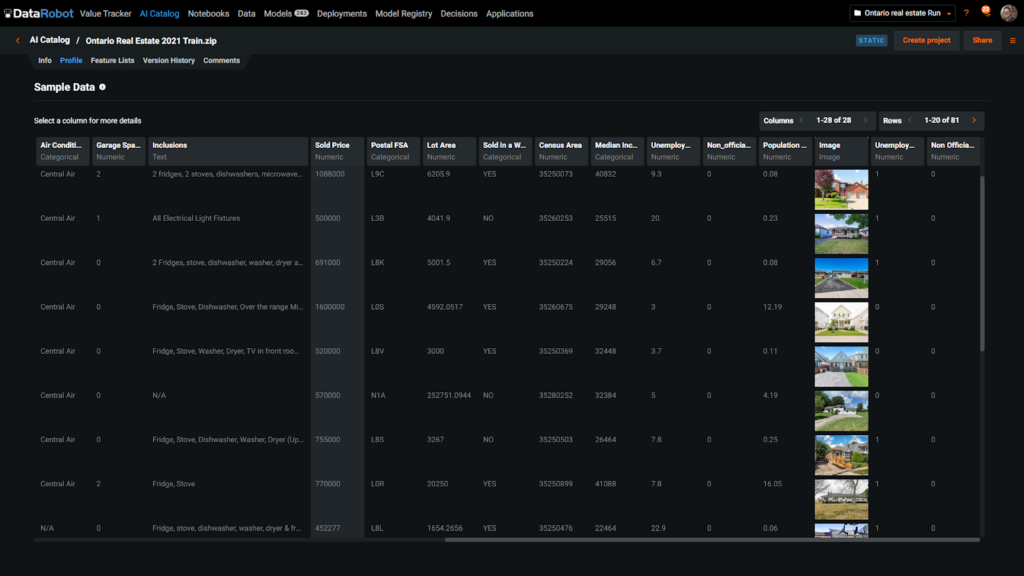
We start by exploring a dataset from the DataRobot AI catalog. The DataRobot AI catalog fosters collaboration by providing users a system of record for datasets, the ability to publish and share datasets with colleagues, tag datasets, and manage the lineage of the dataset throughout the entire project. In essence, the AI catalog allows you to crowdsource datasets in a way that is highly relevant to your business, using already existing assets to build models that are most useful to your business.
AI catalog encourages a culture of collaboration and sharing data assets that will benefit your organization, leading to big gains in productivity, sharing new sources, and creating a collaborative environment for enterprise AI.
You can also manage access control and sharing permissions to these datasets, in case you are dealing with sensitive data that should be accessible only to a limited number of stakeholders.
Estimating Asset Value Using the DataRobot AI Platform
According to the Federal Housing Finance Agency, the U.S. price index rose by 19.17% year over year in 2021, which was a large increase from the prior year’s 6.92% growth—so large that it was the highest annual growth on record.
In such a hot market, how can teams leverage AI to ensure that they are assessing the right values in their respective markets? The demo from the session highlights unique and differentiated capabilities that empower all users—from the analysts to the data scientists and even the person at the end of the journey who just needs to access an instant price estimate.
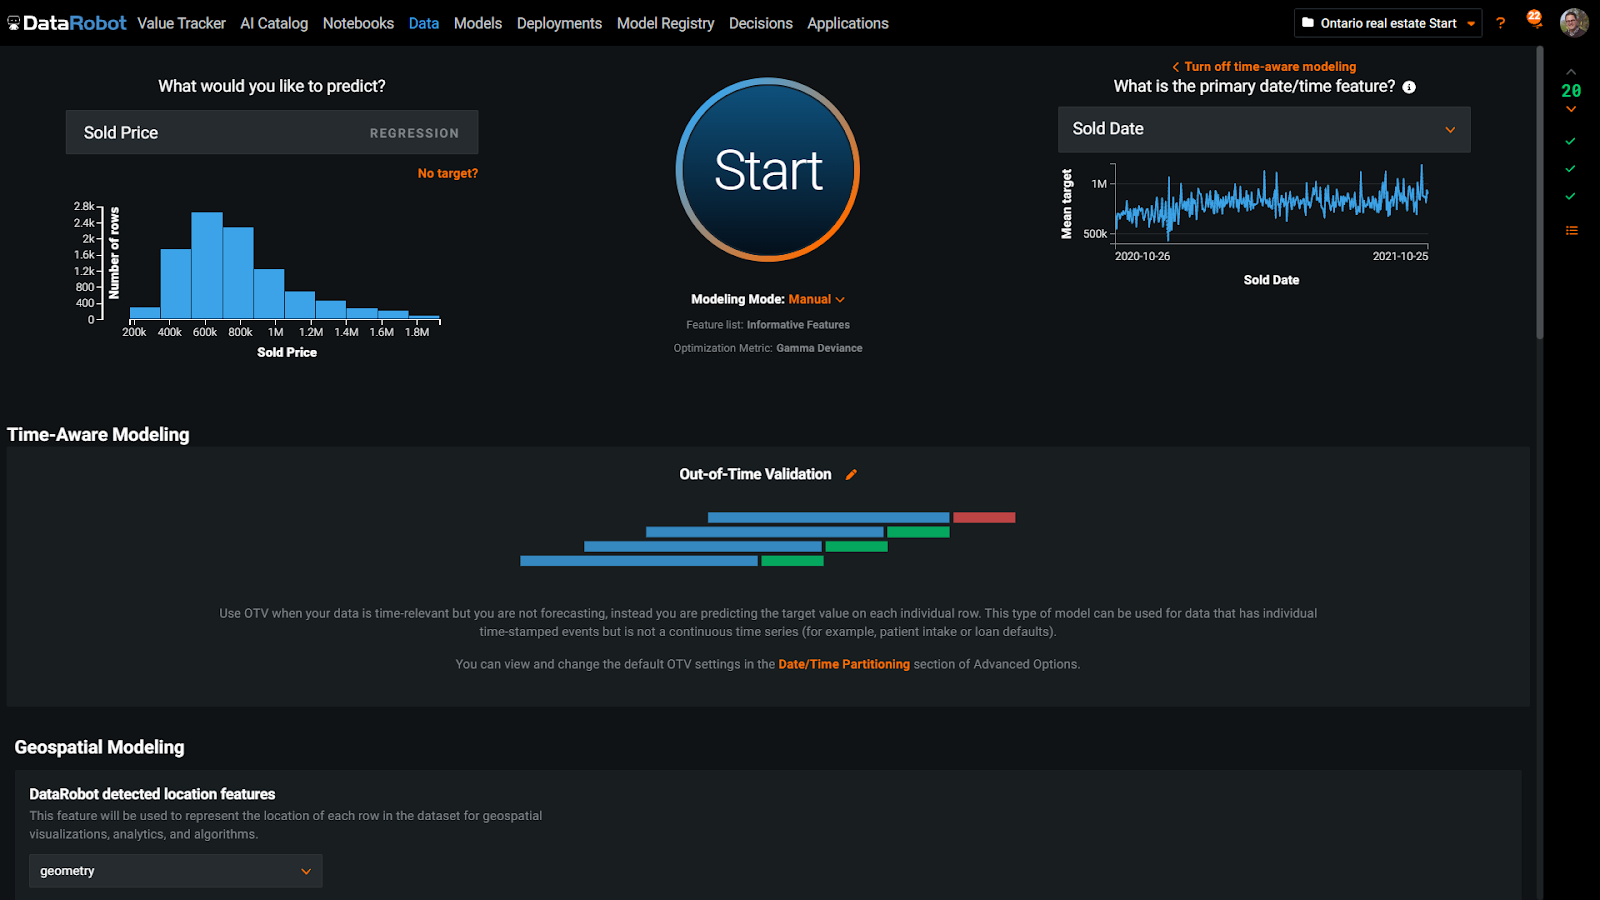
In our demonstration, we utilized a real estate dataset from Ontario which included past sales records of properties. Our objective was to create a machine learning model that could accurately predict the selling price of a single-family home.
When considering a property, we take into account several factors such as its location, size (square footage), and the number of bedrooms and bathrooms. Additionally, we also analyze unstructured information such as what amenities come with the property, for example a sauna or light fixtures, and review accompanying photographs. By analyzing all of this information, we aim to gain insights and determine an estimated selling price for a new property.
The real estate market changes over time, so it’s important that our model learns from past data and is tested on a time frame from the future. DataRobot helps you automate this backtesting by setting up Out-of-Time Validation that forces your model to learn from records before a certain date and then validate against data that comes after that cut-off point.
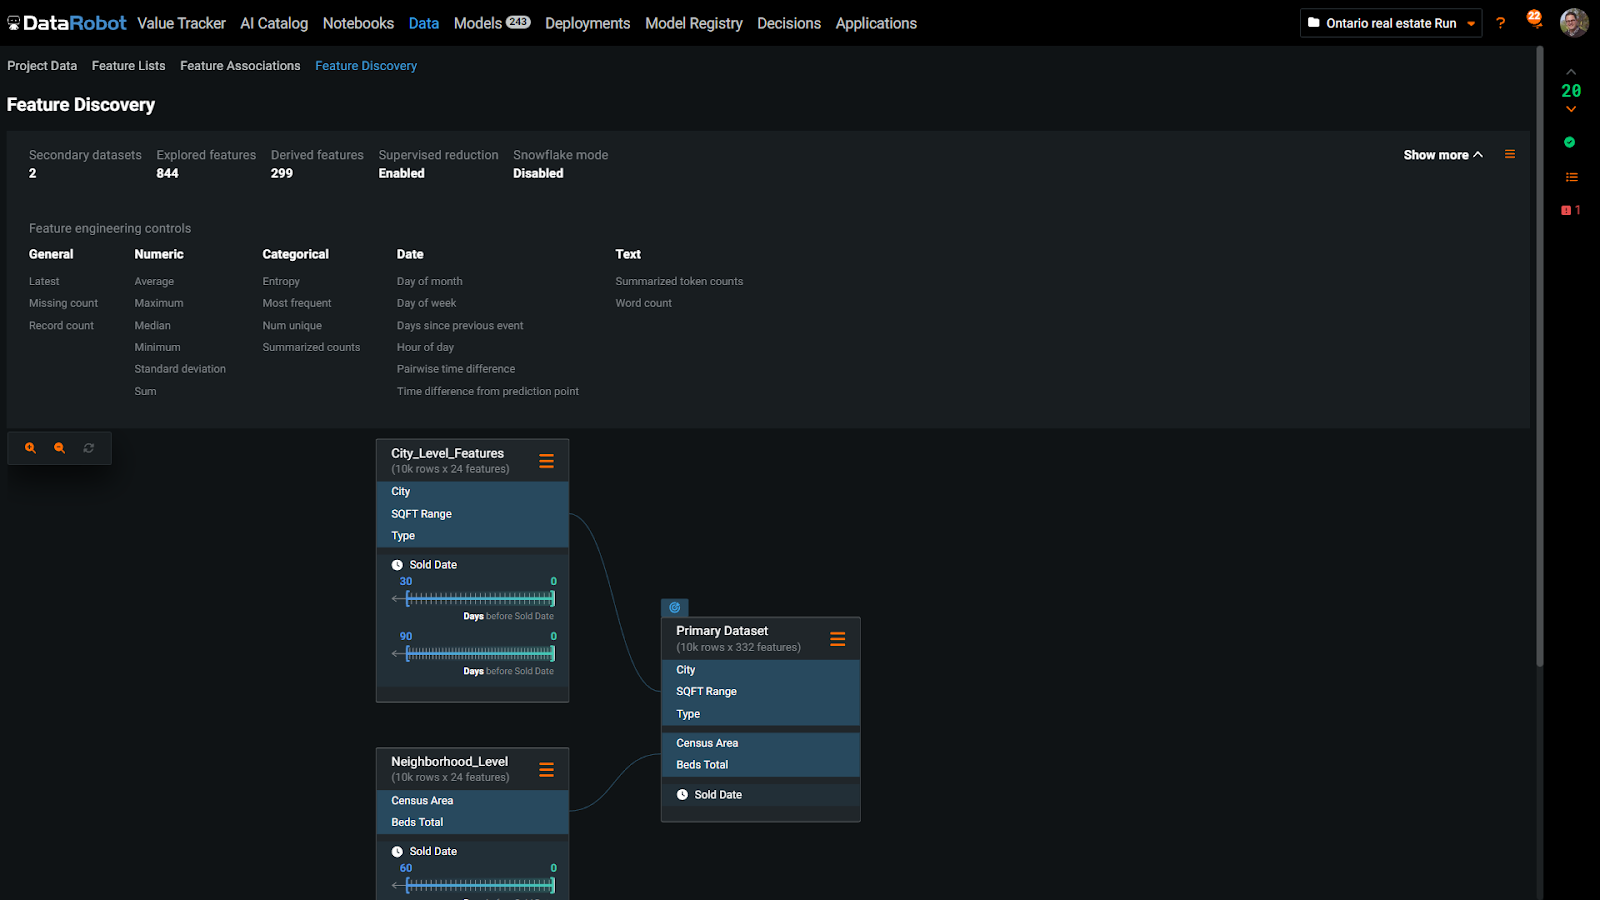
When working with location-oriented data like houses in a neighborhood, a capability that really helps within DataRobot is Automated Geospatial Feature Engineering that converts latitude and longitude into points on the map. These points drive a feature engineering process that clusters nearby homes together and calculates many values such as the average selling price in that location.
Automated Feature Discovery is another differentiator that will have an impact in this use case. It allows us to easily combine data from other sources and summarize it at the unit of analysis of our project. In this example, we have census data at the neighborhood and city level which DataRobot will incorporate into our project at the property level. Also, it will automatically compute moving aggregations, such as the average price by neighborhood for the last week, month, and three months. These data preparation tasks are otherwise time consuming, so having DataRobot’s automation here is a huge time saver.
After setting up your project, you can get started. Hit the Start button, and DataRobot will begin exploring vast combinations of feature engineering steps and machine learning models. Automated feature engineering reveals many insights by creating new features from existing ones. This helps with getting more creative with your experimentation.
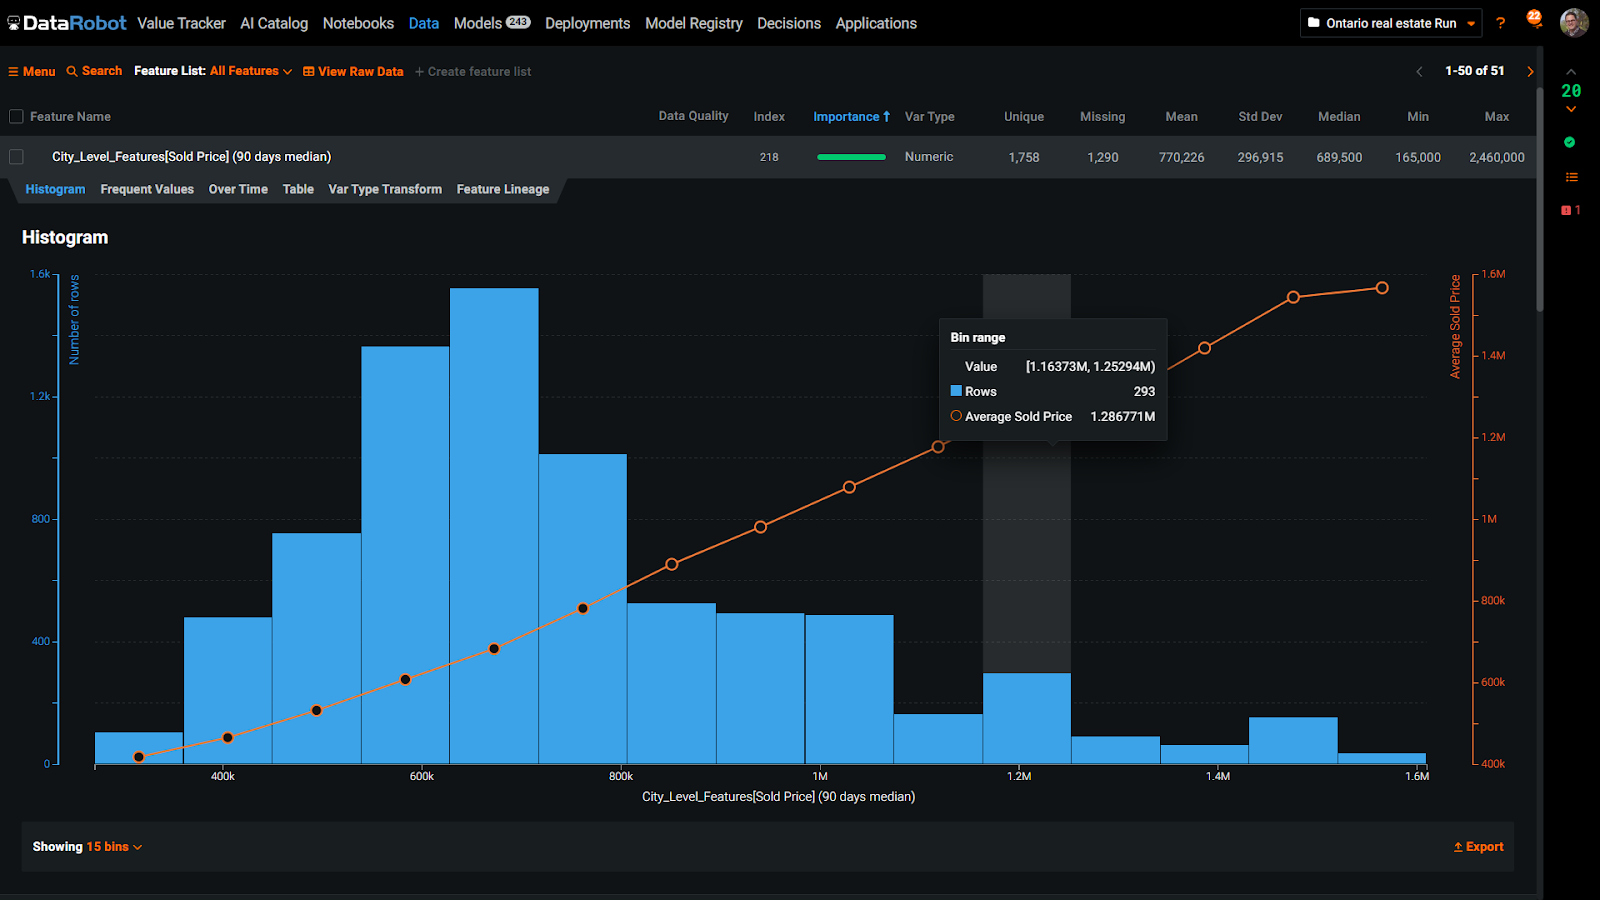
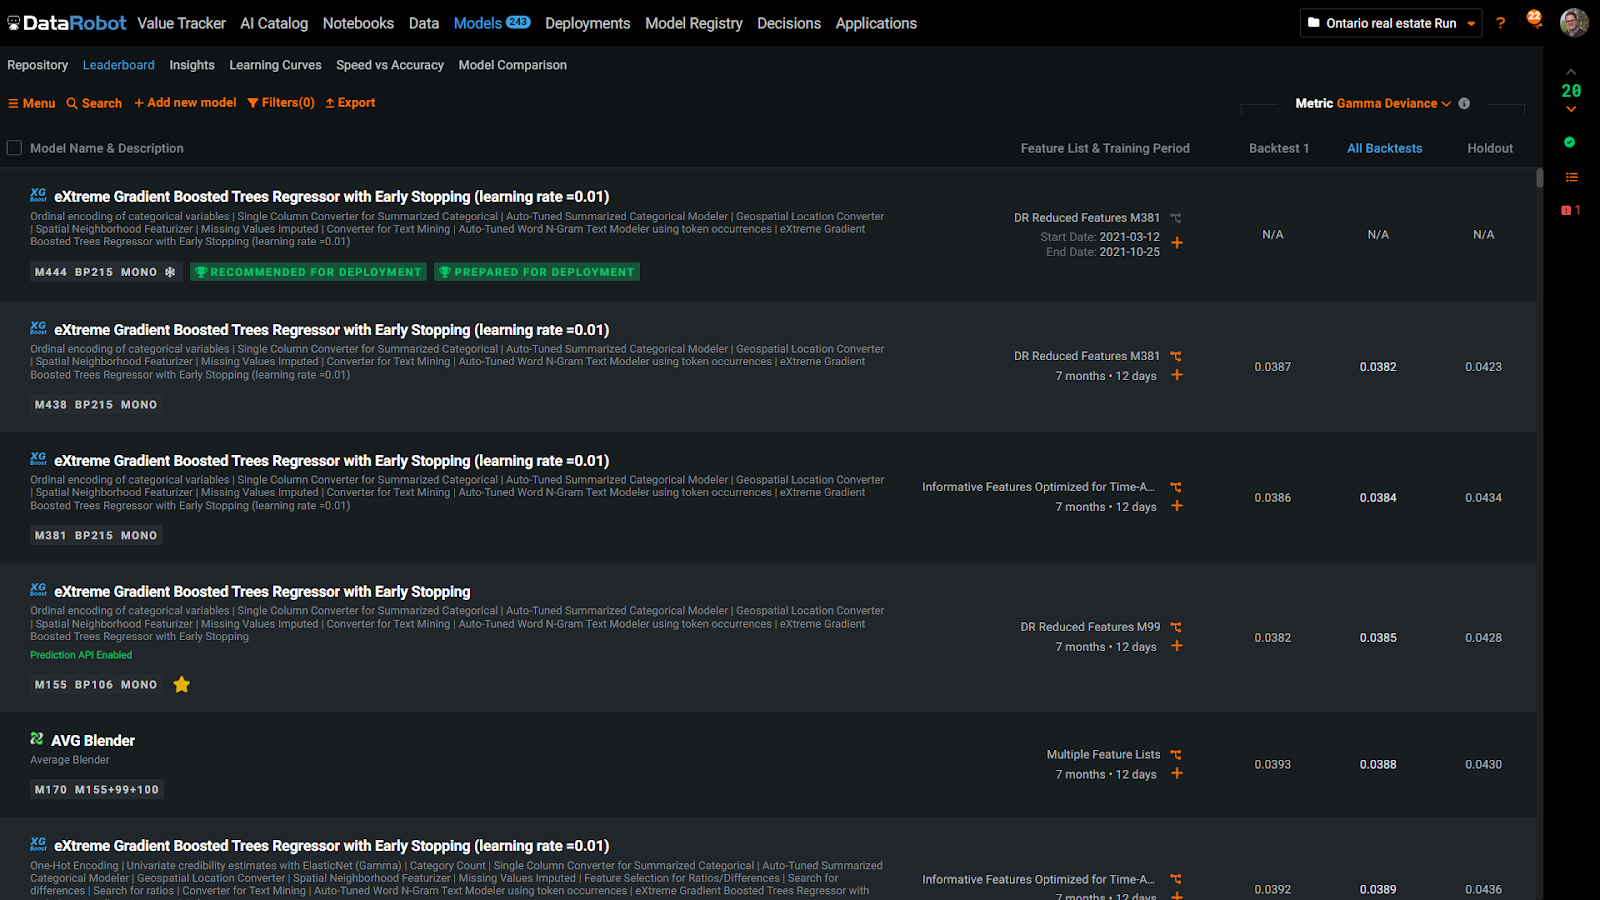
As we run the model, we see that taking the 90-day median of the sold price at the city level was a useful predictor. DataRobot does a great job of explaining exactly how it got to this feature. It joins the primary data with the city-level dataset and calculates the moving 90-day median.
Delivering Explainable and Transparent Models with DataRobot
Explainability is a key differentiator in DataRobot that allows for smoother collaboration on your team. DataRobot also provides several tools for understanding the behavior of the model and gaining insight into why predictions are generated as they are. Feature Lineage, Feature Effects, Prediction Explanations, and SHAP (SHapley Additive exPlanations) allow for a comprehensive examination of the model’s underlying logic and decision-making processes. These tools provide valuable information on the relationships between features and predictions, enabling data scientists to make informed decisions when fine-tuning and improving their models.
DataRobot provides a leaderboard showing results from different experiments, including a diverse range of algorithms, preprocessing, and feature engineering. The algorithm blueprint, including all steps taken, can be viewed for each item on the leaderboard. This allows data scientists to easily compare approaches and choose the best model for their needs.
In each blueprint, users can make custom modifications via drag and drop or code, to test their own ideas, aided by DataRobot’s safety guardrails. As experiments progress, DataRobot provides insights through its use of location features. It highlights the areas where predictions were accurate and those where the model struggled. This information helps data scientists understand where improvements can be made by identifying mistakes and incorporating additional data.
After training a model, it is important to assess its fairness. DataRobot offers the ability to evaluate bias by conducting a bias and fairness analysis. By incorporating census data, such as language or unemployment information, DataRobot can determine if certain neighborhoods are unfairly treated compared to others. The analysis may uncover attributes that improve accuracy but negatively impact fairness. To address this issue, DataRobot provides the ability to manage bias by placing greater emphasis on underrepresented features, improving fairness and enhancing the trustworthiness of the AI model.
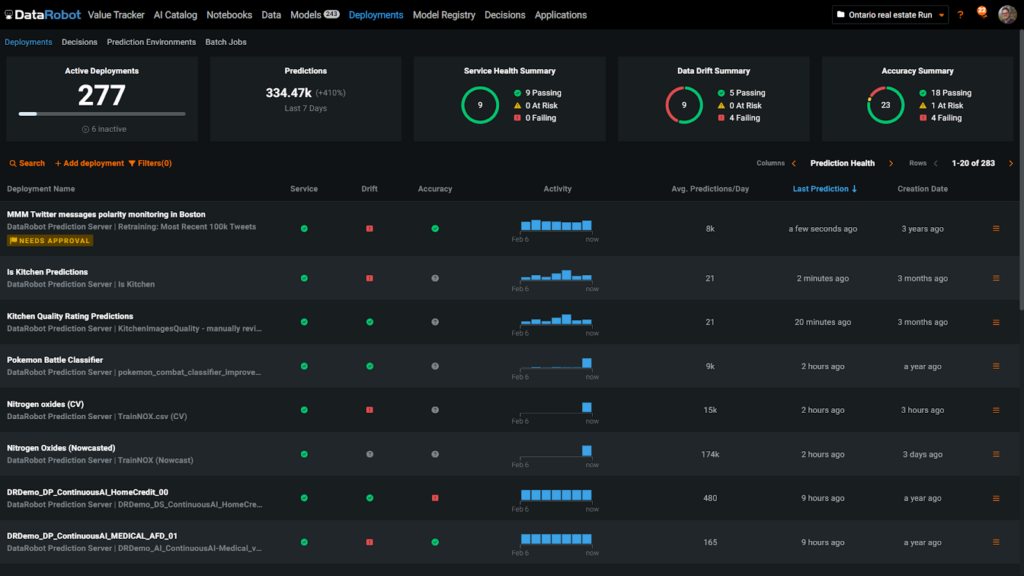
DataRobot makes it simple to take your model live. With just one click, your model can be containerized and accessible through an API endpoint. The MLOps command center gives you a birds-eye view of your model, monitoring key metrics like accuracy and data drift. The Accuracy tab specifically shows how the model’s accuracy has changed since deployment, helping you keep track of its performance in the real-world.
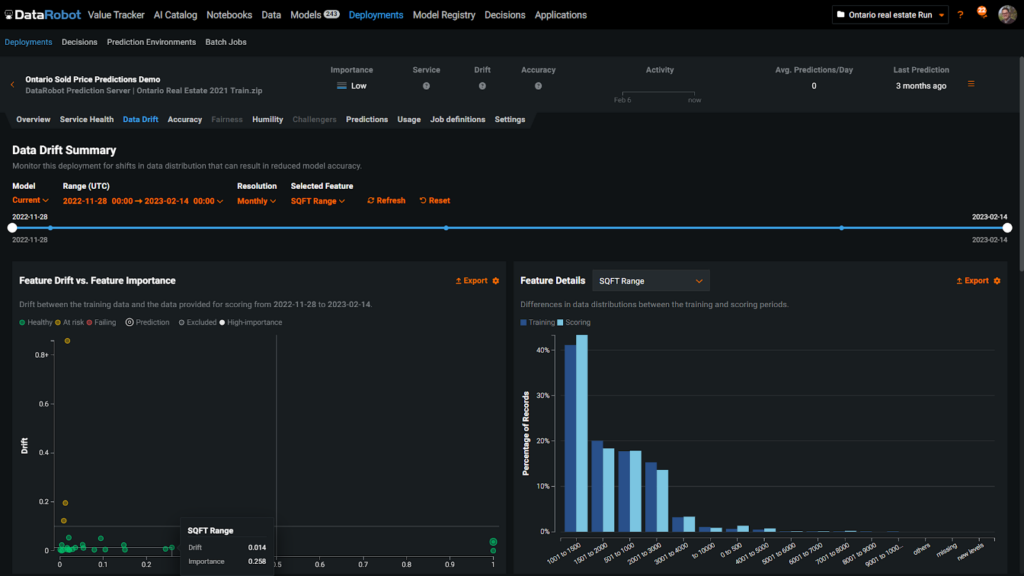
The Data Drift tab displays a scatter plot of the model’s input features, offering a real-time glimpse into the data the model is using to make predictions, such as the type of flooring, proximity to schools, or the exterior of the home. This illustration demonstrates that the model is encountering home exterior types that were not part of its training data, which can lead to unexpected outcomes and decreased accuracy. To prevent this, alerts like this serve as a reminder to retrain the model, an action that can easily be automated within DataRobot.
After retraining the model, DataRobot will replace the outdated model with the updated version. Additionally, you can add the newly retrained model as a challenger, allowing you to compare the performance of both models across various metrics. The option to designate the new model as the champion is also available, enabling you to evaluate their relative strengths and weaknesses.
Finally, you can generate an application that serves as the front-end for the model, allowing users to input variables and get predictions. These business applications can be shared with anyone, enhancing their ability to make informed real-world decisions.
DataRobot Gives Your Team End-to-End Automation, Accuracy, and Fairness
The DataRobot AI Platform empowers your team with features and capabilities that solve some of the most pressing problems teams face when implementing AI. The platform allows your team to clean up data, make adjustments, run experiments, gain insights, ensure fairness, and deploy the model to end users— optionally without writing a line of code. DataRobot can also connect different types of data, including geographic and time series data.
With DataRobot Automated Feature Engineering, your team can streamline the process of blending external datasets and save time by consolidating and preparing data for model building. This feature helps simplify the model building process, getting better results faster.
With DataRobot AI Platform, you can deploy, monitor, and manage your production model with ease. Teams can also build AI apps without writing code and collaborate within a single system of record, setting up user permissions and governance. This simplifies the AI development process, freeing up data scientists to focus on more strategic tasks.
Leading enterprises worldwide rely on DataRobot to deliver successful AI projects, managed by cross-functional teams including data scientists, IT infrastructure specialists, and business units. Effective teamwork and clear communication are key to ensuring a smooth, seamless, and successful process.
1Gartner, How to Overcome the Top 6 Roadblocks to D&A Leader Success, Jorgen Heizenberg, Carlie Idoine, May 4 2022
Get Started Today.