


Probabilistic Forecast: Managing Uncertainty to Overcome Changing Trends
“Divide and rule,” or “divide and conquer” in its original Latin, is attributed to Julius Caesar and refers to the conquest of Gaul in the 1st century BC. The saying can be understood in the context of the interests of a conqueror mindset but also has some political and sociological meaning. According to Wikipedia, one of those meanings is “gaining and maintaining power by breaking up larger concentrations of power into pieces that individually have less power than the one implementing the strategy.” And apparently, Julius applied this technique successfully in the conquest of multiple territories.

Even though machine learning has nothing to do with conquering territory, machine learning is about strategy, just another type of strategy. However, there is a way in which the phrase “divide and conquer” is perfectly applicable. As a general rule of thumb, any problem that can be broken down into smaller pieces is more easily manageable. And yes, that usually has to do with data-related problems.
Big Problem. Big Solution.
When we constantly handle massive amounts of trend data, understanding the drivers of that data is important if we want to define an appropriate business strategy based on that input. Dividing the problem into multiple mini-problems will help us better understand each possible scenario and define particular and non-generalistic solutions.
In recent times, banks and large financial institutions have suffered setbacks due to macroeconomic forces set off by the pandemic and because of the way predictive models have changed as a result of clients’ behavioral shifts. A typical, usually incorrect, time series strategy in financial institutions faces the following pain points right now:
- Manual Forecasting: Financial forecasting is often a manual and mundane task, taking between five and ten FTE days a month and involves human error and significant operational inefficiencies when scaled out globally. A quick fix approach that we often see is calculating three-month moving averages with a large financial analyst workforce creating just-in-time reports, limiting the accuracy of forecasts and the ability to react quickly to changing market dynamics.
- Granularity: Forecasting is typically completed at the product family or account level, mainly due to the cyclical nature of manual forecasting processes and wide variations of product, market, and line of business combinations. This means large organizations simply don’t have the time or resources to create granular, product-level forecasting. Aggregate forecasts are therefore created, often reducing the overall accuracy of the forecasts and limiting deeper insights.
- Enhanced Analysis: Due to the challenges of manually intense forecasts and lack of granularity, existing financial forecasting techniques limit the finance function’s abilities to complete advanced analysis, such as real-time, what-if scenario analysis, which is extremely relevant for all businesses due to the economic impact the COVID-19 pandemic.
All of this requires a plan and a change of strategy to deal with the problems at a much more granular level, take control of trends, and understand what drives the decisions of our customers in these challenging times. This is the time for big solutions.
Auto Time Series to Drive Business Value
Julius Caesar understood better than anyone the importance of approaching problems on a small scale, but he did not have the option of applying multiple approaches or simulations at the same time to help him estimate which was the most correct.
Large banks and institutions of considerable size face the additional problem of having the necessary capacity to be able to deal with problems derived from constant manual changes. And as in so many other cases around technology, it is not just about capacity for action, but capacity for reaction — something that is critical today.
Many companies have been using DataRobot’s automated machine learning to leverage AI to address their pain points and drive value by applying automation in the right way and across the right steps in their machine learning workflows:
- Building granular, market, and product models that are able to identify trend changes at scale and that would not be possible to build manually.
- Creating a real-time, what-if scenario strategy enhanced with explainability, empowering business to rapidly respond to macroeconomic shifts.
- Centrally managing and monitoring the performance of these models in an automated and standardized solution.
It All Comes Down to Business Value
Let’s create a scenario, where you run a global organization with 50 individual products, across three lines of business with operations in 30 markets globally. In order to accurately forecast individual products across these markets and lines of business, the finance organization will need to forecast, on average, five key metrics. This would require a resource-intensive global finance team that understands the market and product intricacies and manually forecasts 15,000 metrics. This is where technology and automation play a critical role in driving operational efficiencies and straight-through processing.
- Time Series Forecasting Models: Building and deploying time series models to automate the monthly forecasting process can help streamline 5-10 FTE days per finance analyst, per month who are normally building these manual forecasts. In order to build these 15,000, product-level forecasting models, finance functions will require an automated time series solution to rapidly build, test, and deploy these models at scale, avoiding the requirement to have a large cohort of data scientists manually building these models. Being able to deliver product-level forecasts will, in turn, result in a higher level of accuracy in the aggregated forecasts.
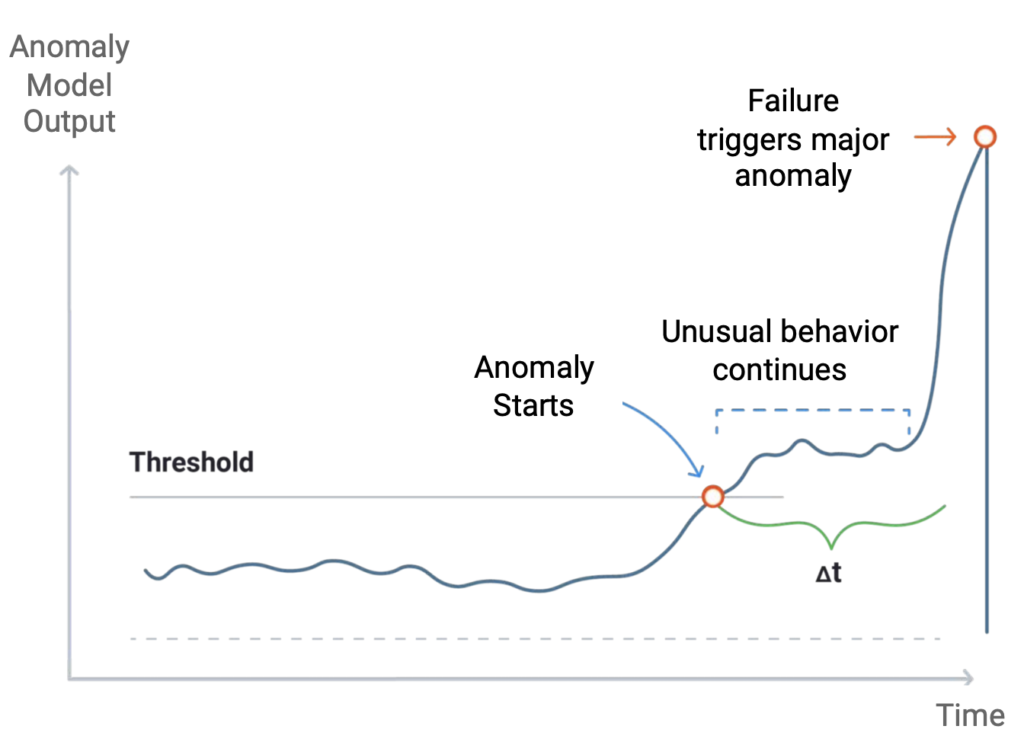
- Real-Time, What-If Scenario Testing and Anomaly Detection: Once these financial forecasting models have been deployed, you have the ability to run a range of real-time simulations, adjusting indicators of financial drivers and completing what-if scenario analysis to stress test potential future scenarios that the business might be exposed to. This has been increasingly used in recent months due to the uncertainty around economic outcomes due to COVID-19.
- Capital Reserves: Financial forecasting is part of the overall process organization to define annual capital allocation for reserving and spending. A key part is understanding the cost of over- or under-reserving. For example, over-reserving funds by $10M doesn’t cost the business $10M, but there is an opportunity cost of keeping that capital in reserves when it is not required. Being able to forecast more accurately through granular forecasts, therefore, will result in optimizing capital reserve for the business.
Try. Fail. Try Again.
“Experience is the teacher of all things.” –Julius Cesar
“Try again. Fail again. Fail better.” –Samuel Becket
Machine learning is nothing but the study of computer algorithms that improve automatically through experience. In short, algorithms learn from the past to forecast the future, but the way that this forecasting happens has more to do with applying the right techniques at every step of the machine learning lifecycle. Reaching the right level of granularity will typically help you to understand better the short-term dynamics hidden in your data, what is already in place that will help you to build a better model, and what will help to make better decisions. As in anything else, experience matters, but with DataRobot’s automated machine learning, it is easy to gain such experience much faster by simulating multiple what-if scenarios and eventually making the safest decision for this complex changing world.
About the Authors:
Javier Lombana is a Lead Customer-Facing Data Scientist at DataRobot working in the United Kingdom, and leading DataRobot’s banking data science practice supporting customers across multiple EMEA regions. Javier has more than 15 years of experience in Data Science and Analytics and before joining DataRobot he worked as Data Science Manager at Capgemini Financial Services. He owns a M.sC in Data Science from Universitat Oberta de Catalunya and a B.sC in Computers Science Engineering from the Polytechnic University of Madrid.
Qian Zhao is a Customer-Facing Data Scientist from DataRobot based in London where he helps customers from fintech, banking, and healthcare to accelerate their machine learning capabilities using the DataRobot platform. Prior to joining DataRobot, he was data science manager at PwC and Deloitte to lead a team of data scientists delivering innovative and cutting edge AI and machine learning to the enterprise. Qian received his Ph.D. degree in Neuroscience from University College London in 2012.
Stephan Paul has a wealth of experience supporting financial services organisations applying data science and intelligent automation to solve business problems and drive multi-million dollar ROI. He has a B.Sc in Economics from Royal Holloway, University of London and prior to DataRobot, worked as a management consultant at Ernst & Young.
DataRobot is the leader in Value-Driven AI – a unique and collaborative approach to AI that combines our open AI platform, deep AI expertise and broad use-case implementation to improve how customers run, grow and optimize their business. The DataRobot AI Platform is the only complete AI lifecycle platform that interoperates with your existing investments in data, applications and business processes, and can be deployed on-prem or in any cloud environment. DataRobot and our partners have a decade of world-class AI expertise collaborating with AI teams (data scientists, business and IT), removing common blockers and developing best practices to successfully navigate projects that result in faster time to value, increased revenue and reduced costs. DataRobot customers include 40% of the Fortune 50, 8 of top 10 US banks, 7 of the top 10 pharmaceutical companies, 7 of the top 10 telcos, 5 of top 10 global manufacturers.
-
How to Choose the Right LMM for Your Use Case
April 18, 2024· 7 min read -
Belong @ DataRobot: Celebrating 2024 Women’s History Month with DataRobot AI Legends
March 28, 2024· 6 min read -
Choosing the Right Vector Embedding Model for Your Generative AI Use Case
March 7, 2024· 8 min read
Latest posts
