

Predicting Churn: How Data Can Help with Customer Retention
Customer retention is a big concern for companies. The cost of acquisition is typically 5 to 25 times more expensive than the cost of retaining a customer. However, you don’t want to put all of your customers through retention programs. You may end up driving customers away who don’t want to be bothered. On the other hand, some customers may want to leave regardless of what you offer them. How do you identify the ones you can still save?
The answer is customer churn modeling. But this isn’t as simple as throwing your data into a spreadsheet and building a model. You likely have customer data spread across many different data sources. Aside from general demographic data about each customer, such as when they first became a customer and where they live, perhaps you have their purchase or product usage history. You may also have their interactions with your support team or survey responses. Joining this data together can provide greater insights into why a customer might churn. So, how do you pull all of this data together into one location?
What Does Churn Mean for Your Business?
Before you work on combining your data sources, there are important data and business aspects to consider. First and foremost, you need to define what you mean by churn. Is it customers who will not make a purchase in the next 30 days? The next year? Or are you a subscription-based company, and your churn is determined on whether or not a customer renews their subscription? The answer to these questions will define how you create your target variable (churn) and what time frame you will want to focus on.
The next question to address is, how much data do you have? If you have thousands or hundreds of thousands of customers, then you can sample your customers from a determined fixed time period. A customer will never be in more than one row in this dataset.
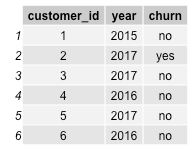
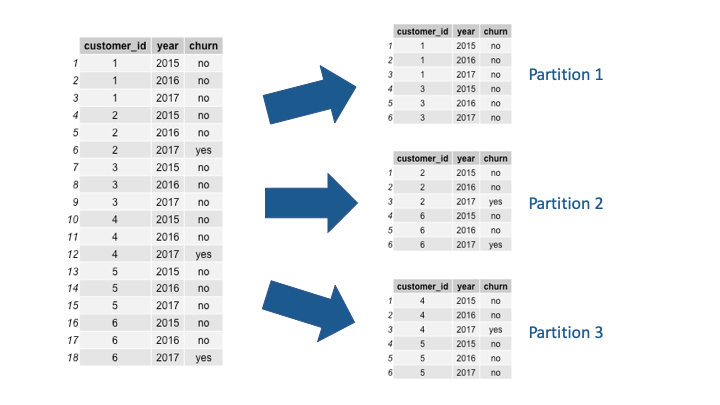
But what if you only have a few hundred? If your data is limited in the number of observations, then you can create a dataset where each row represents one time slice for a customer. In this setup, you will have multiple observations (time slices) for each customer. The time slice will be determined by how you define churn. If you define churn as purchases within the next 30 days, then one time slice will be one month, and each customer will have a number of rows equal to the number of months they have been (or were) a customer. If your customers are on annual subscriptions, then one time slice will be one year. In this scenario, your data is cumulative and it is important to partition your data by customer. If one customer’s data is split across multiple partitions, then your out-of-sample predictions will not truly be out-of-sample and your models will overfit to your training data.
Finally, you need to understand what your company will do with this customer churn model. What good is it to predict who will churn tomorrow if one day is not enough time to convince the customer to stay? Focus on which stakeholders will leverage these predictions. Will customer support use this model to spend extra time on the customers most likely to churn? Can your marketing team offer discounts or premium products to convince the customer to stay? This will not only influence the time period you model but also give you clues on which features you need to include in your data. Keep in mind that the further in time you predict, the less data your models will have to leverage. Thus your models will likely decrease in accuracy. At the end of the day, there is a tradeoff between accuracy and actionability. Working closely with the consumers of your model’s predictions will ensure they get the business results they need with models they can trust.
How to Avoid Look-Ahead Bias
The most common mistake we see in churn modeling is look-ahead bias. For churn models, it is easy to include data that you would not have at the time of prediction in your models. For example, if you predict on January 1 which customers will leave within the next year, then you cannot include the number of purchases in February. Similarly, if your random sampling selects whether or not a customer churned in 2017 and one of your features is average monthly spend, then you need to be careful not to calculate average monthly spending across the lifetime of the customer. It must be the average monthly spend prior to 2017. Thinking about areas of potential target leakage in advance can help your models perform as expected once they are in production environments.
Once your dataset is in hand, DataRobot can help you build the best model for your use case in a short amount of time. Our solution will automatically build dozens of models to find not only the most predictive model but also identify the likely explanations of why a customer might churn. Our models can identify customers who are least likely to churn so you do not bother them with retention emails. For those likely to churn, our explanations can identify what is leading to the loss of the customer. If they are leaving due to something outside of your control, then you know they will go regardless of your efforts and you can focus your time on customers you can still save. Your marketing team will love having recommendations on what they can do for a customer to retain them. Your sales team will know where to focus their efforts, and your whole company will benefit from better business intelligence.
About the Author:
Jake Snyder is a Customer-Facing Data Scientist at DataRobot where he works closely with customers to leverage automated machine learning to drive business value. Jake has a background in applied data science for finance and customer analytics.

-
Belong @ DataRobot: Celebrating 2024 Women’s History Month with DataRobot AI Legends
March 28, 2024· 6 min read -
Choosing the Right Vector Embedding Model for Your Generative AI Use Case
March 7, 2024· 8 min read -
Reflecting on the Richness of Black Art
February 29, 2024· 2 min read
Latest posts
