NOTE: This blog post is intended for actuaries in the Insurance industry. As such, there may be terms that are unknown to those outside of this market
The idea of examining individual claims (as opposed to analyzing aggregate claims data) within the reserving process gained traction in the late 1990s. However, using individual claims for reserving didn’t see broad adoption at the time because there was no urgency or motivation to transform the traditional reserving process, and new processes would require additional people and resources.
Today’s insurance landscape faces new business growth challenges and regulations. For example, EU’s Solvency II technical provisions will have significant differences from current provisions, both in terms of structure and the calculations required. New reserving methodologies that are realistic and reliable are rapidly becoming a necessity for insurers.
Globally, actuaries operate within a highly competitive market that continually exerts more pressure through new reporting standards, which naturally pushes efficiency to new levels. However, despite the increased reporting visibility, management still needs answers that traditional methods do not respondanswer, such as: “Why is loss reserving getting worse in this quarter?” followed by, “What is causing these changes?”
To generate answers to these questions, actuaries are exploring new approaches to analytics by combing through recent historical data to identify and extract additional patterns. New approaches are necessary because the standard approach to analyzing aggregate data may lose important information and can’t find any “shifts” or “mix” that occur during the earlier stages of claims development.
Even adjusting triangle-based data through ‘extrapolation into the tail,’ ‘smoothing,’ or ‘giving greater weight to more recent data than older’ doesn’t provide the necessary level of detail to form a coherent business conclusion.
Last year’s “Non-life Reserving Practices” report by industry analyst firm ASTIN collected surveys from 535 insurers across 42 countries. The report concluded that the most ubiquitous loss reserving methods are still the triangle-based ‘Chain Ladder’ and ‘Bornhuetter-Ferguson’ methods, but the market is moving towards individual claims reserving and big data analytics.
The report also shows that some insurers apply individual claims data for loss reserving through statistical methods like as Bootstrap, GLM, and RJMCMC. According to the report, however, these approaches seem to be too complicated and time-consuming for the majority of insurers, as the methodologies require additional programming skills in R, SAS, and other programming languages, as well as the data scientists required for the developing models.
The micro-level methods are extremely well suited for explaining the lifecycle of each individual claim, from claim occurrence and reporting to payment and settlement. This lifecycle data can then be used to project the development of open claims by using the likelihood approach to historical data with (semi)parametric specifications. This combination provides an unprecedented view of the underlying factors that trigger changes in the structure of aggregate payments.
GLMs were proposed by Taylor and McGuire in 2004 as a methodology that fits the requirements for individual claims development analysis. Pricing actuaries have been using it successfully for a while, even adding machine learning (ML) into the mix to improve the accuracy and velocity of risk assessment. This same tech stack could successfully be used to move away from traditional reserving practices by taking advantage of modeling capabilities that ML offers for individual claims data, coupled with GAM-based or other techniques.
Luckily, today’s availability of computing power and on-demand IT resources allow actuaries to explore advanced tools that support ML techniques, provide access to robust model libraries, and don’t have any issues integrating issues with the insurer’s database. Let’s take a look at examples of such a tool in action.
Practical Examples of Applying ML in the Actuarial Process
Let’s consider an individual claim model, using sample data, to see what goes into a machine learning model, and what extra insights these models can provide over traditional triangle models.
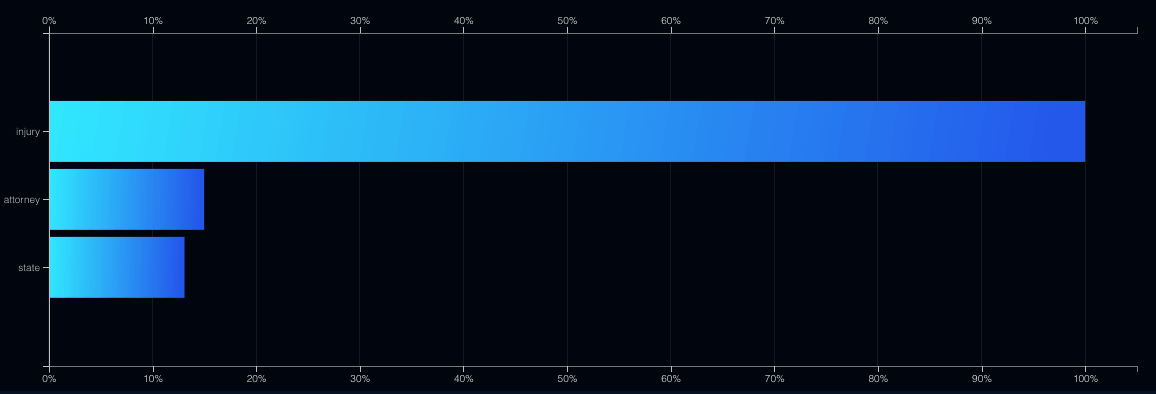
Using the DataRobot automated machine learning platform, we’ll start with the standard reported claim attributes: injury, state, attorney. If this were a real-world project, we could add any information that’s usually available in the rating plans of the relevant product.
Below you see an example of a model that determines features with the highest influence: injury, attorney, state (in the USA) (in order of significance):

Even with hundreds of features in the data set, the DataRobot platform can determine which features should be included in the model and which should be left out.
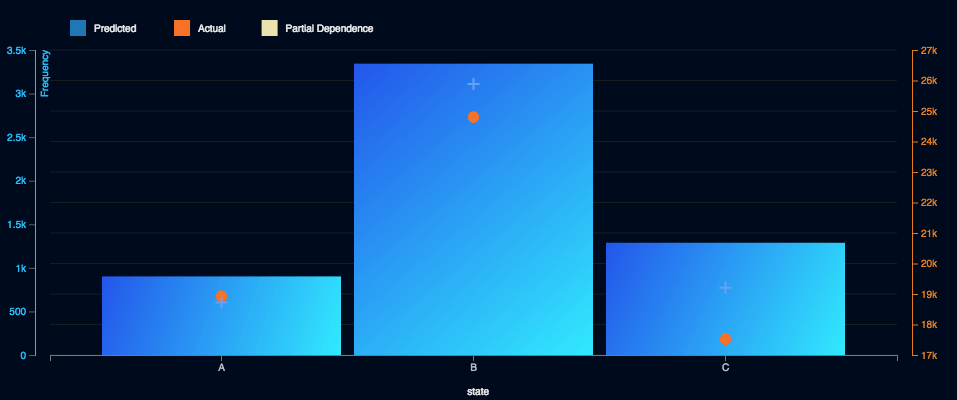
Let’s examine the State feature. In the chart below, the individual identified as ‘B’ has the highest average claim cost, but at the same time, the number of claims coming from B has been decreasing each year (for reasons that haven’t yet been identified).
The model adapts to shifts in the ‘state’ feature because it was trained to find the amount of the potential payout (claim cost), a huge advantage over all triangle-based methods.

Let’s compare the methods and their respective results. The goal was to predict the total ultimate loss for 2016 since we already know the full payment amount for each claim in the dataset.
| Comparison Metrics |
Chain-Ladder Method |
Individual Claims Method (eXtreme Gradient Boosted Model) |
| Accuracy (Predicted vs. Actual) |
|
|
| Tools |
- R for prearranged processing of the huge dataset
- Excel for the calculation
|
|
| Advantages |
- Well known by insurers & actuaries
|
- Detects aggregate changes within the structure of
the losses (‘mix shift’ in ‘states’)
- Simultaneous development of numerous models
(it’s up to you to choose the one most appropriate for
your business goals)
|
| Challenges |
- The method is adjusted based on assumptions
- Doesn’t offer business insights
|
- Requires the user to build a training dataset, which
could be complicated due to changing requirements/
conditions (e.g. changing settlement rate)
|
To save time DataRobot can also do a lot of work ‘behind the scenes’ to improve the efficiency and velocity of the modeling process: impute the missing values, propose a suitable metric, simultaneously tune a lot of algorithms, validate/cross-validate, and much more.
This functionality keeps the actuary’s attention on analysis, not on coding or other technical requirements for building a model. All of this is layered behind an intuitive, user-friendly interface that lets you start producing models with a couple of clicks.
These advanced machine learning techniques allow us to dissect the data in a manner that facilitates more precise reserving, which directly affects the competitive performance of insurers.
Conclusion
Individual claims modeling provides unparalleled business insights, like determining the underlying factors behind the deteriorating loss ratio at the earliest stages of claims development. This in turn can improve the accuracy of technical provisions and guide other divisions in an insurance organization (underwriting, claims management, pricing, and reinsurance) toward more efficient and profitable business practices.
In this capacity, DataRobot’s automated machine learning delivers faster, more accurate results, which liberate actuaries from a number of routine tasks. DataRobot’s built-in intelligence chooses which algorithms to use, and doesn’t require manual programming. This allows actuaries to focus on the quantitative analysis of the results, model performance evaluation, and rigorous methodology review.


