


Moving from Red AI to Green AI, Part 2: A Practitioner’s Guide to Efficient Machine Learning
In our previous post, we talked about how red AI means adding computational power to “buy” more accurate models in machine learning, and especially in deep learning. We also talked about the increased interest in green AI, in which we not only measure the quality of a model based on accuracy but also how big and complex it is. We covered different ways of measuring model efficiency and showed ways to visualize this and select models based on it.
Maybe you also attended the webinar? If not, take a look at the recording where we also cover a few of the points we’ll describe in this blog post.
Now that we have covered a few select ways of measuring efficiency, let’s talk about how we can improve it.
In their paper, Green AI, Schwarz et al give an equation that explains the variability in resource cost to build models.
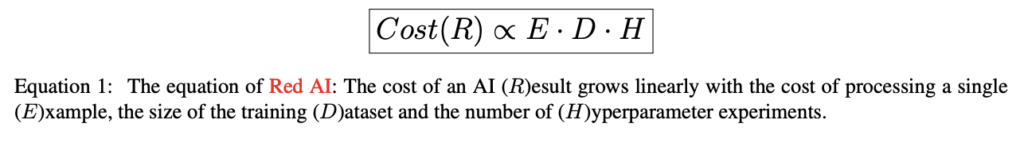
It is a bit of a simplification, but schematically, it covers the different pieces that multiply into the resources required. Below are my two cents on how to approach these parameters to minimize resource cost:
- E, as in processing a single “Example”
- An example would be a row of data, or an “observation”
- This observation needs to pass through the parameters in the model
- Use a small model, with fewer necessary parameters, both in training and in scoring
- Avoid deep learning if it’s not a use case that truly demands it (very few use cases do)
- D, as in size of “Data”
- More data normally increases accuracy, but the marginal contribution decreases quite quickly, (i.e., after a while, adding more data will not increase accuracy, and in some cases actually make it worse)
- The Goldilocks Principle: Don’t use too much data, but also not too little
- Filter out as much as possible prior to modeling – that goes for rows as well as columns!
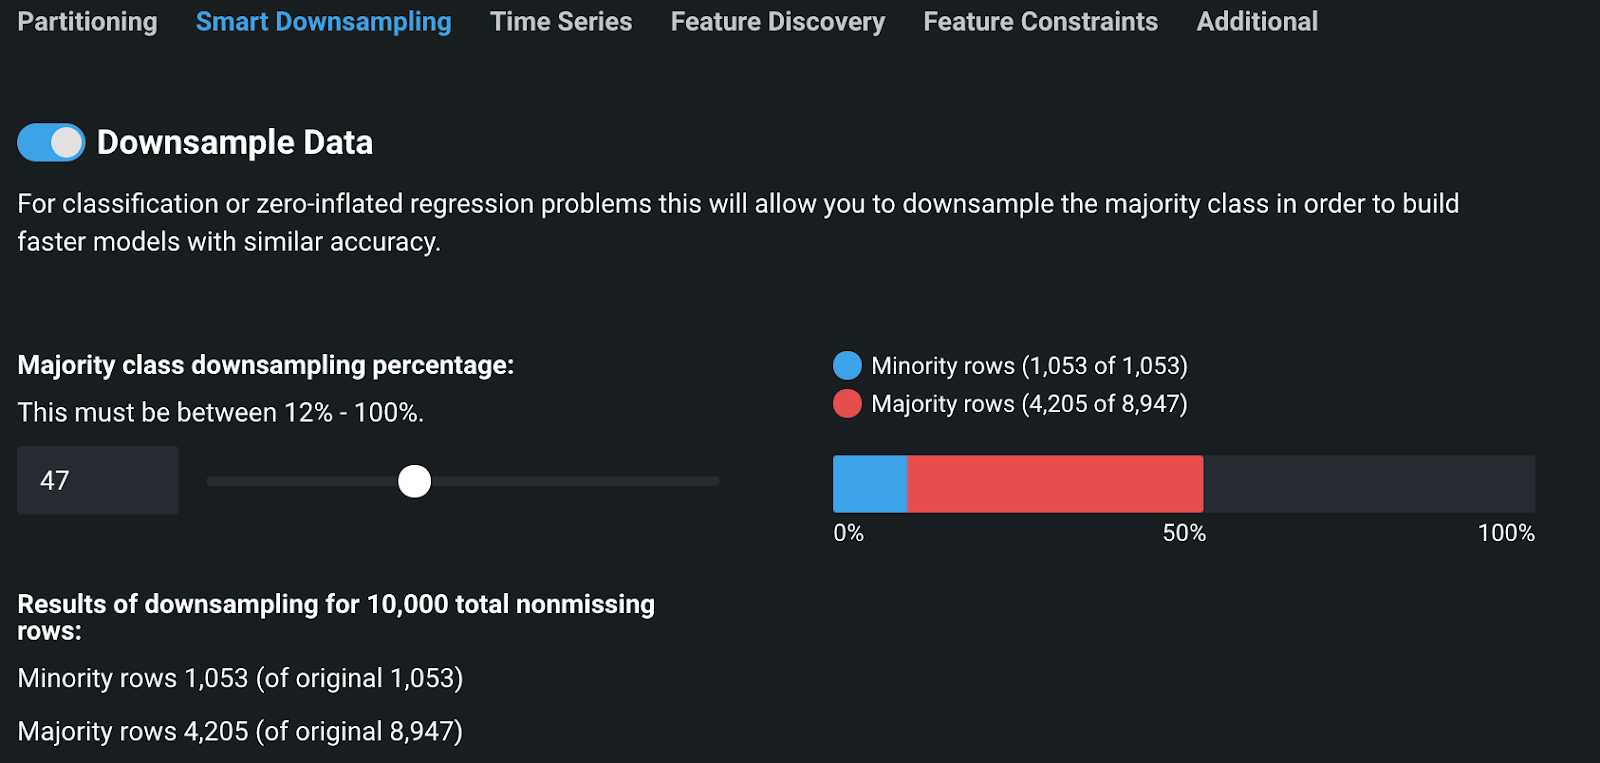
- For classification or zero-inflated regression: Downsample the majority cases.
- Start with a sample: Don’t use all your available data before you know which model is likely to perform best
- Use feature selection techniques, both prior to modeling and after modeling
- Consider file types: JSON, for example, is larger than CSV, and if you score JSON all the time, after a while it will actually matter
- H, as in “Hyperparameter experiments”
- Hyperparameters are tuned to maximize the predictive power of a model, and there are many ways to optimize these hyperparameters
- If you do it manually by testing different combinations, the probability of not reaching maximum possible accuracy is reduced, and the probability of wasting a lot of compute resources is increased
- Use automated optimization techniques that are not “brute force” (i.e., testing every possible combination)
- Hyperparameter tuning is beneficial to some extent, but the real efficiency gains are in finding the right data
I’m sure you can come up with some suggestions yourself, and perhaps some that are specific to the environment you’re running on.
In DataRobot, in practice, we actually have a lot of built-in features that allows you to work efficiently with your data. We have always had a relentless focus on being fast in order to deliver insights as well as putting models in production, and it has never been our business to increase the compute resources necessary to build models. It’s also important for the user experience that the entire model building lifecycle runs fairly quickly on the platform.
Ways to Measure and Improve Efficiency in DataRobot
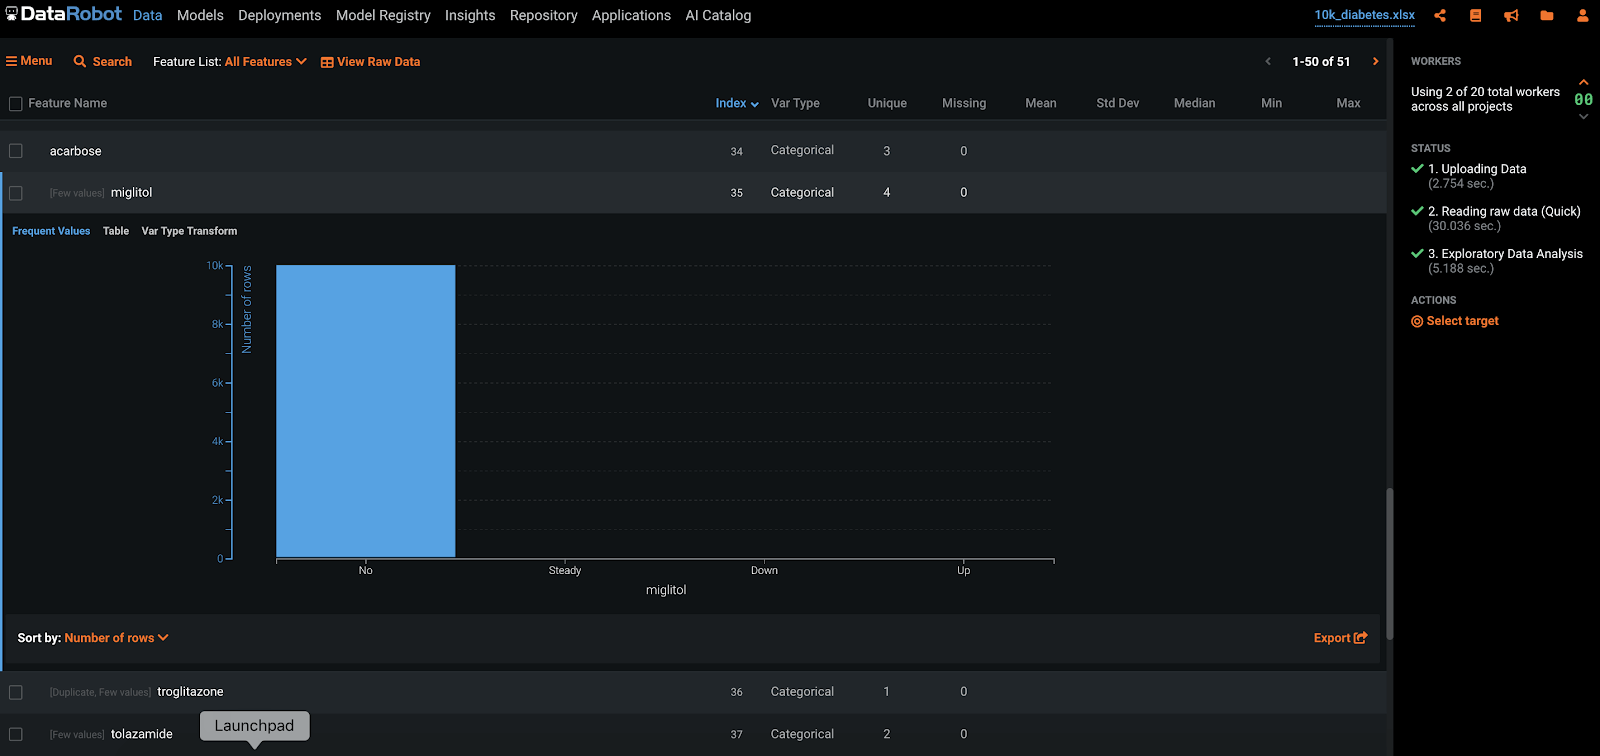
Prior to modeling, DataRobot removes redundant features from the input dataset, meaning features that do not pass a reasonability check. Here’s an example from our classic diabetes readmissions dataset. All the features with a parenthesis in grey next to it, are deselected from model building, as they are not informative. Several logical checks are performed. The example highlighted below “miglitol” has four unique values, but almost all of them are “No,” meaning that this can’t be used to build something useful.
Also, for classification or zero-inflated regression problems, you can downsample your data to build models more efficiently, without losing accuracy.
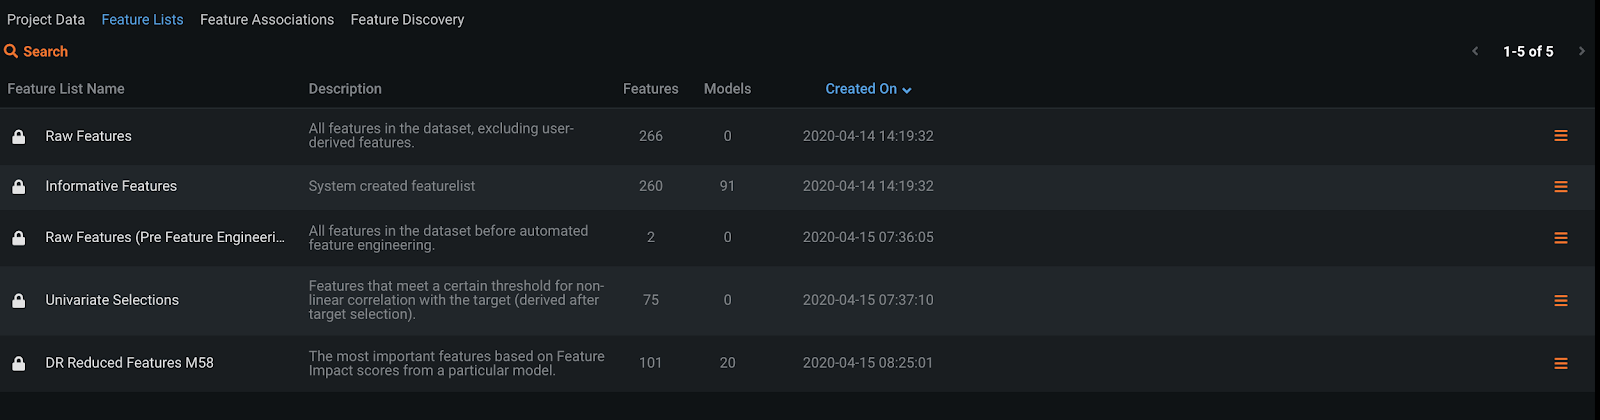
DataRobot automatically creates lists of features that are used for modeling, while also providing easy ways for the user to do so. Below are a few examples.
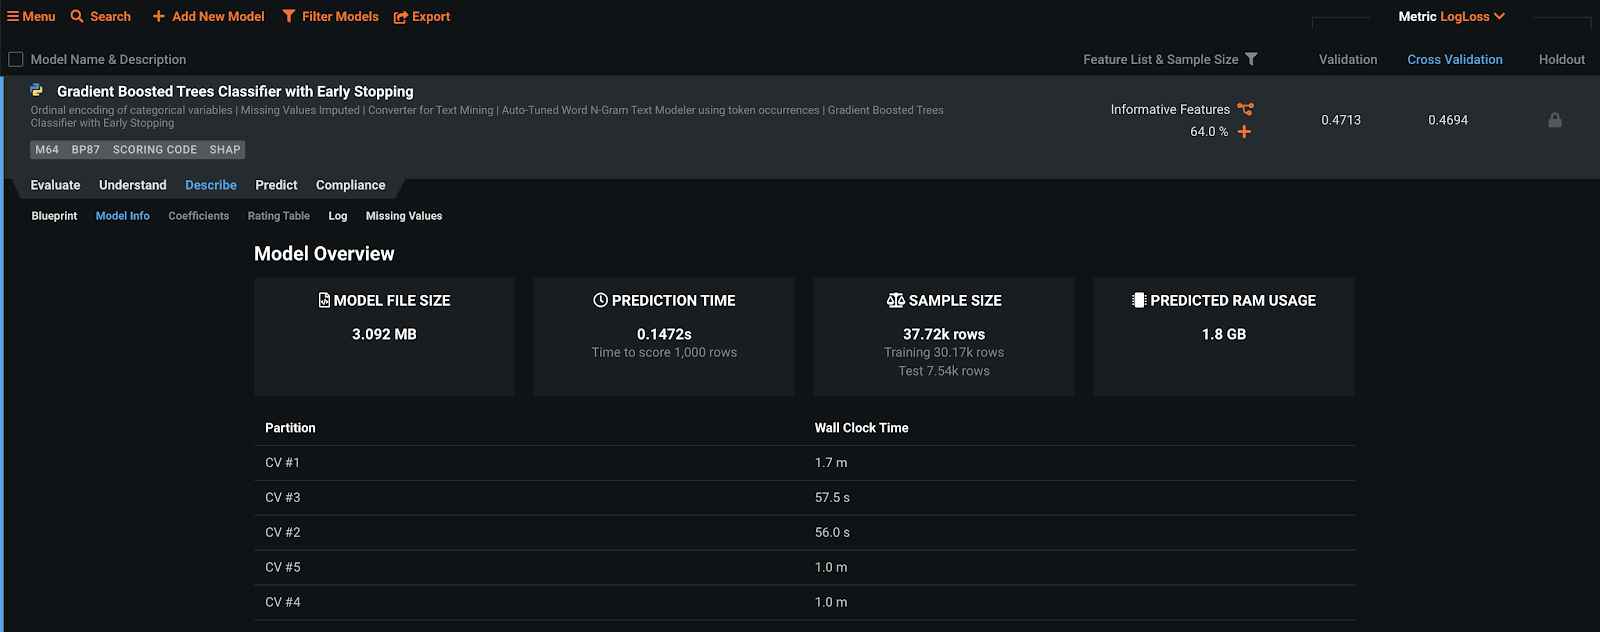
For each blueprint in DataRobot, the Model Info tab provides many measures of energy and time required for the model, and accuracy is always clearly displayed. This view actually delivers four out of the five efficiency metrics that we discussed in the previous blog post. Model size, training time (wall clock time), prediction time, training energy (predicted RAM usage). Combine these with your accuracy metric and find the efficiency of your model!
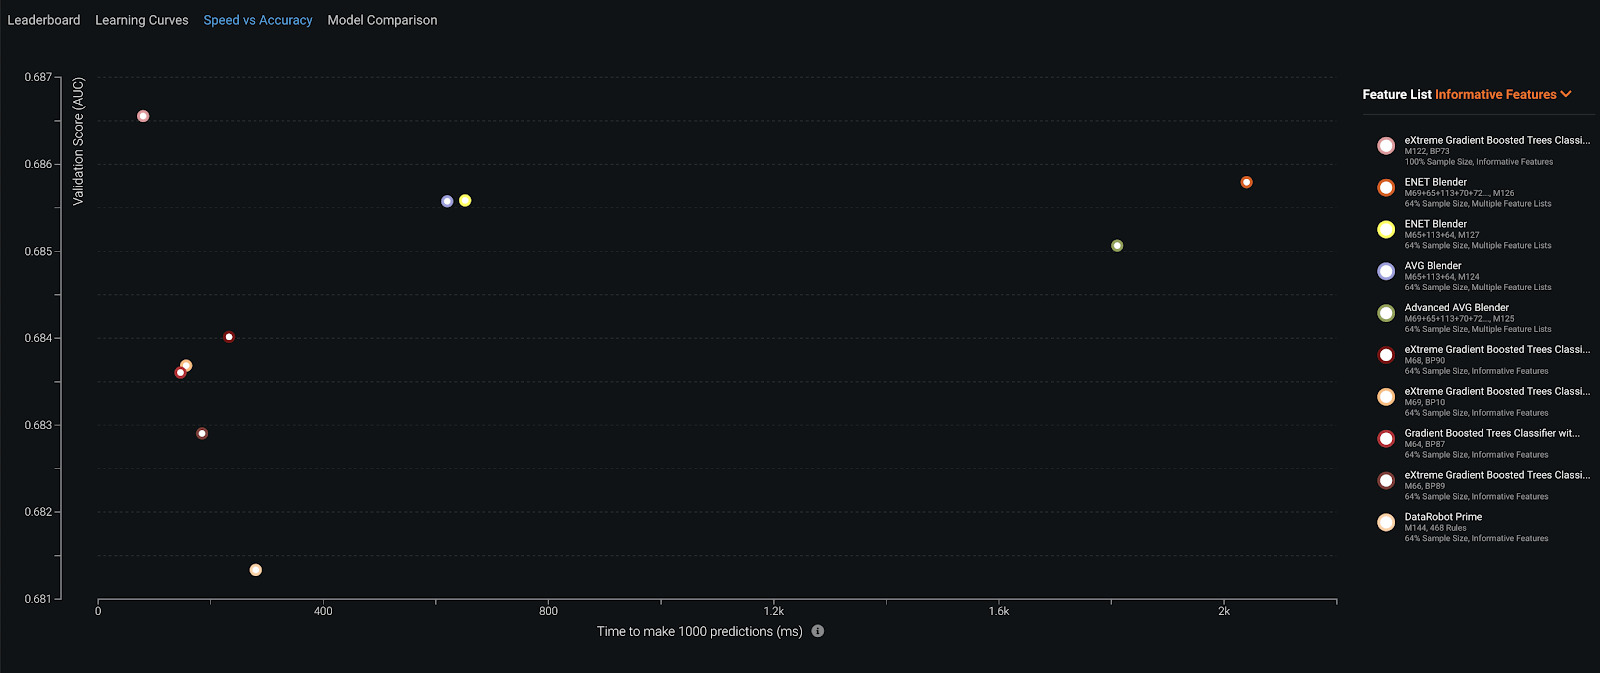
The Speed vs. Accuracy tab shows you immediately an efficient model from an inference time efficiency perspective. The model with a high accuracy and a low time to score a certain amount of records is the most efficient one.
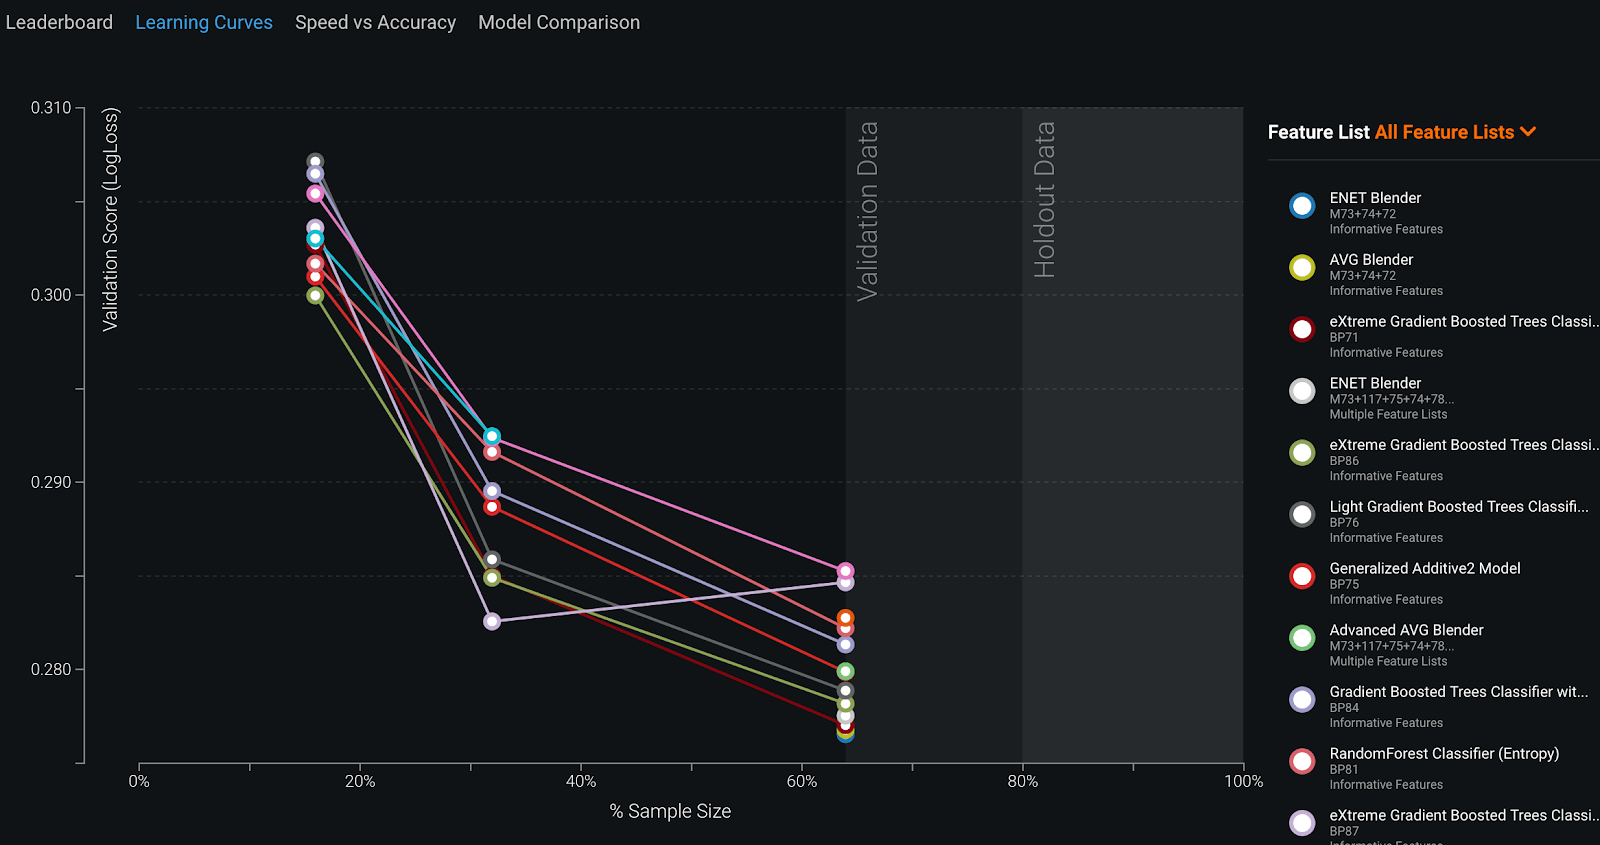
The Learning Curves visualization shows you immediately if you need to add more data to your model building. If the curve hasn’t decreased in the last step of the visualization, it probably won’t help to add even more data.
Conclusion
There are many technical ways to minimize the cost of Red AI. Make sure to use them and integrate them in your pipelines.
However, some are harder to automate, or even measure, in a software, and this is where we as intelligent human beings can make the most impact.
As for reducing the number of features in your data, remind yourself of what features will be available at the time of prediction. This will require talking to whoever is going to consume the predictions, as this will not be detected by any algorithm. A well-built model that contains a feature that isn’t available at prediction time is a waste of time and resources.
Furthermore, ask yourself if high accuracy really is important for what you want to do. Do you just want a few high-level insights? Or do you want to make a large amount of accurate predictions?
Another common (mal)practice is to retrain models just because there is new data available. This is normally because of failure to monitor models in production. This means that you’ll use a lot of computational resources (and probably your own time) without knowing if it is necessary. Monitor your models carefully.
In the next blog post on Green AI, we’ll cover something a bit more high-flying than these technical things. Stay tuned, stay green, and above all stay safe!
What’s Next?
Since these blog posts were written, a lot has happened in the world and in machine learning. One thing, unfortunately, hasn’t changed: Climate change is a threat to the lives of billions of people and it’s not pausing.
Many of our customers have spent a significant proportion of their machine learning endeavors on use cases that can help them reduce their climate impact or mitigate negative impacts from climate change in order to help nature and society. Here are a few of my favorite public examples:
- OYAK, a cement manufacturer, 7.5x their alternative fuel usage with AI
- AI empowering the sharing economy by improving the use of cars
- Using machine learning to detect and prevent low water quality
- Companies providing anything from computers to fresh fruit do their best to reduce waste with AI driven forecasting
I personally work very closely with our manufacturing clients in the Nordic countries, and what they have in common is that they’re all prioritizing use cases related to the new green economy we’re all trying to build. Use cases range from fuel optimization, energy waste, operational efficiencies, to reduced unplanned downtime. Furthermore, it also becomes quite clear with these customers that there are indeed a lot of low-hanging fruit when it comes to applying machine learning and AI to reduce a company’s carbon footprint.
So my question to you is: What use cases have you planned for this year that will have a net positive impact on your company’s carbon footprint? Whatever it is, make sure to share it so other’s can be inspired.
He provides technical guidance to businesses across the Nordics to help ensure they are successful. He conducts demonstrations, delivers proofs-of-concept and solves business problems with AI. He started out as an aspiring political scientist but then fell in love with quantitative methods and became a statistician at Uppsala University.
-
How to Choose the Right LLM for Your Use Case
April 18, 2024· 7 min read -
Belong @ DataRobot: Celebrating 2024 Women’s History Month with DataRobot AI Legends
March 28, 2024· 6 min read -
Choosing the Right Vector Embedding Model for Your Generative AI Use Case
March 7, 2024· 8 min read
Latest posts
