

Interpreting the Hotspots Results in DataRobot
This post was originally part of the DataRobot Community. Visit now to browse discussions and ask questions about DataRobot, AI Platform, data science, and more.
This article showcases how you can interpret the Hotspots results from within the DataRobot Insights tab.
DataRobot generates hot and cold spots which are essentially simple rules with high predictive performance. These rules are available when:
- A RuleFit classification or Regression model has been trained.
- At least one numeric column exists.
- There are fewer than 100K columns.
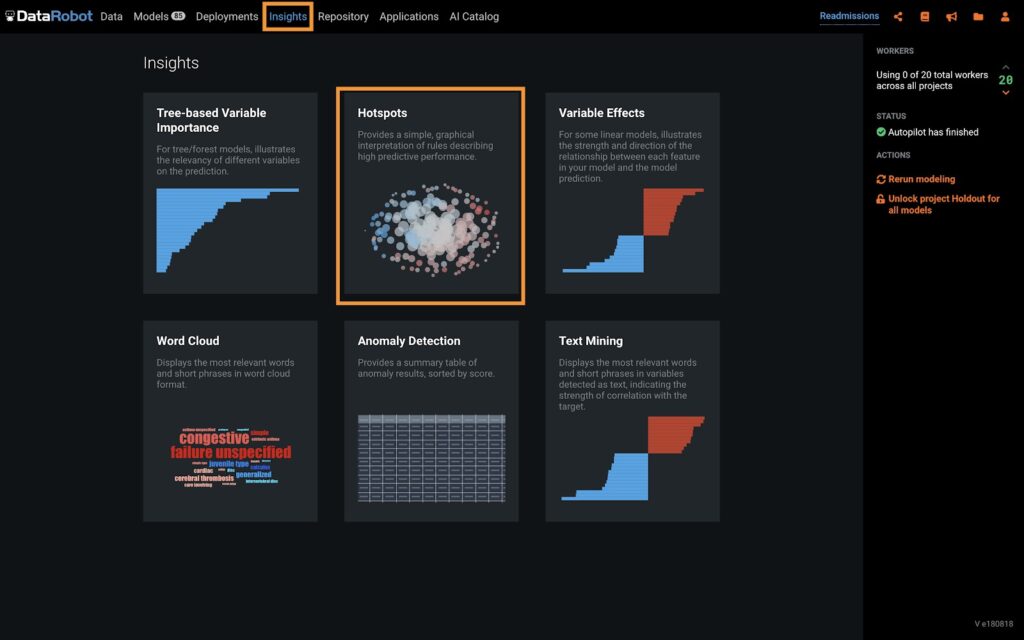
Accessing Hotspots
To access hotspots, navigate to Insights and then click Hotspots (as shown in Figure 1).
You see the Hotspots page (Figure 2).
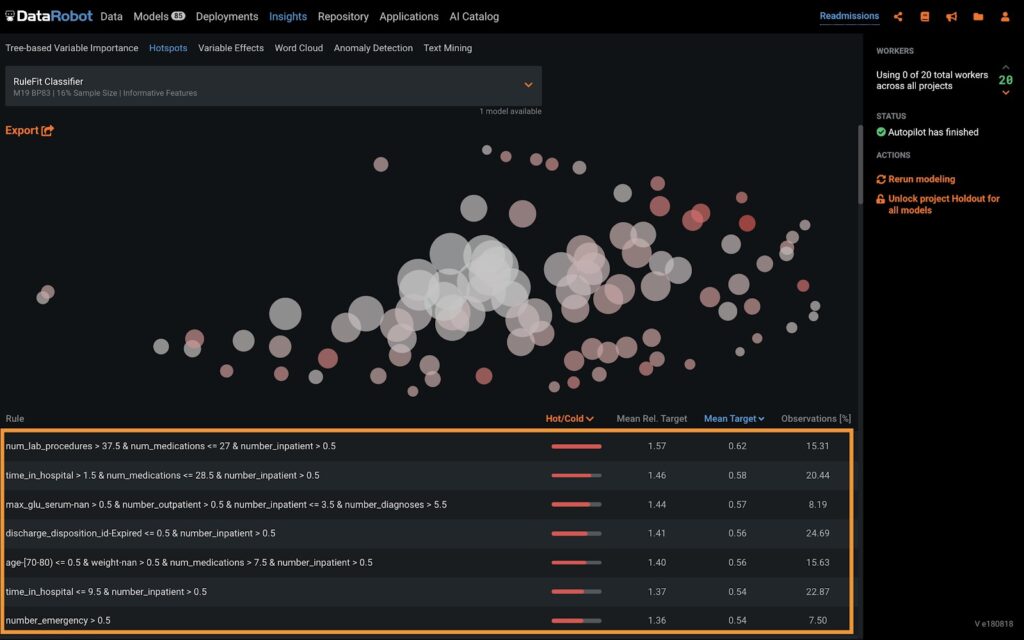
At the top of the page, you see a bubble plot where each bubble represents a set of rules that have been extracted from the model. The bubble size tells you the frequency of that set of rules, while the color of the bubbles indicate the predictive power of these rules. In our example, a red (or hot) bubble means high probability of rehospitalization while a blue (or cold) bubble means a low probability of rehospitalization.
There are three different ways to extracted rules:
- Hover over a bubble.
- See a list view of the rules from within the UI.
- Export the rules (PNG, CSV, or ZIP format).
Through the list view in the UI you can sort these rules by their mean target value, which will show the rules that lead to a high probability of a patient being rehospitalized.
Rules are generally easy to read but pay extra attention to categorical features. For example this is the 4th rule in order of appearance in Figure 2:
discharge_disposition_id-Expired <= 0.5 & number_inpatient > 0.5
- Discharge_disposition_id is a categorical feature.
- Number_inpatient is a numeric feature.
You read this rule as follows:
If discharge disposition does not have the value “Expired” and if the number of inpatient stays is > 0.5 (same as > 1 since this is integer), then the average probability for the patient to be rehospitalized is x%.
The advantage of hotspots is that:
- They are short and can be interpreted by a person.
- They can be transferred outside of DataRobot. For example, you could use them to enhance a rules-based prediction engine that your team has created.
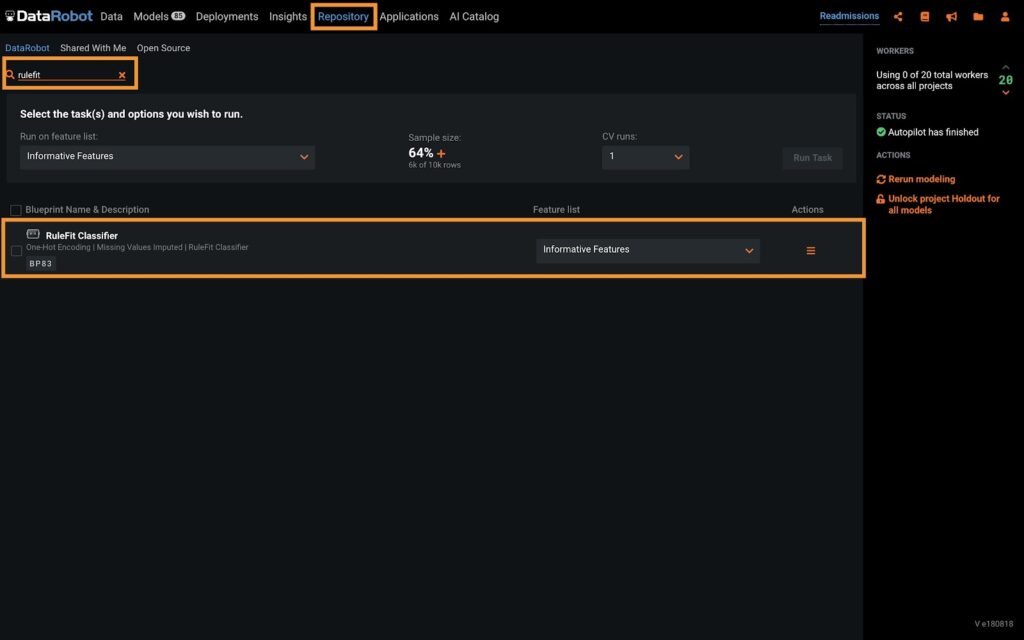
Lastly, if you do not see Hotspots under insights, then navigate to the repository and manually run a RuleFit classifier or regressor blueprint. Figure 3 shows an example of this process.
More Information
Find out more about Hotspots by visiting our public documentation portal and navigating to the Hotspots Insights section.

-
How to Choose the Right LLM for Your Use Case
April 18, 2024· 7 min read -
Belong @ DataRobot: Celebrating 2024 Women’s History Month with DataRobot AI Legends
March 28, 2024· 6 min read -
Choosing the Right Vector Embedding Model for Your Generative AI Use Case
March 7, 2024· 8 min read
Latest posts
