

How to Understand a DataRobot Model: Understanding Why a Prediction Has Its Value [Part 8]
A recently published research paper from Columbia University described a common dilemma in machine learning. Back in the mid-1990s, one cost-effective healthcare initiative investigated the application of machine learning to predict the probability of death for patients with pneumonia so that high-risk patients could be admitted to the hospital while low-risk patients were treated as outpatients. This had the potential to simultaneously improve health outcomes while reducing hospitalization costs. But the most accurate machine learning algorithms were not intelligible. With people’s lives on the line, it was decided that the risk of black-box models was not acceptable, and they selected a less accurate rule-based algorithm that was more intelligible.

This choice of algorithm was vindicated when they discovered something strange. The rule-based algorithm learned the rule that patients with pneumonia who have a history of asthma have a lower risk of dying from pneumonia than the general population. This was counterintuitive with studies showing asthmatics having a high mortality risk from pneumonia. Further investigation showed that upon admission to a hospital, asthmatics suffering from pneumonia were often sent directly to the Intensive Care Unit and given the extra effective care that they needed, with consequently improved outcomes. If they had used the more accurate, but unintelligible, algorithms they may have inadvertently put asthmatics lives at risk by assessing them as low risk and sending them home.
While your organization may not make life-or-death decisions, the consequences of using unintelligible black-box models could still be serious. Think of the reputation damage from applying unfair recruitment algorithms, thousands left without electricity when a power grid fails, losses from lending money to bad risks, reduced sales from mis-selling products to customers, or unclean water discharged into a river after a miscalculation in a water treatment plant.
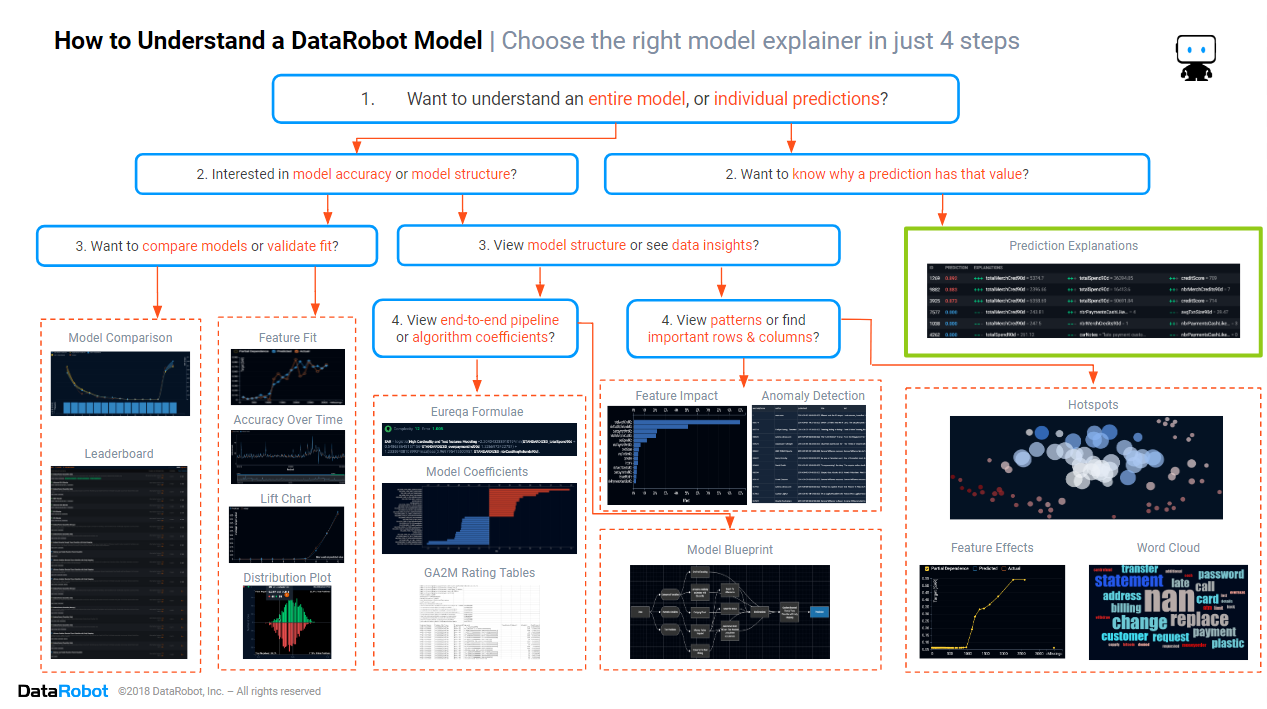
In the previous blogs from this series, we focused on understanding how a model works. We found how to assess the model accuracy, which columns and rows are important in the data, and how to discover the patterns in the data that the model is using. In this blog, we will switch from understanding the model and instead focus on the section of the cheat sheet marked in green above, discovering how to understand the predicted values that a DataRobot model makes, predictions that power the decisions that your AI makes.
Historically, statisticians built models designed to test a single hypothesis. The conclusion was either that the hypothesis was correct or that the hypothesis was incorrect. This led to simple and clear explanations (e.g., the patient’s health improved because they were treated by a new drug). However, statistical models were more difficult to interpret in multivariate analysis, when models simultaneously considered the effects of multiple input feature. It became increasingly difficult to apportion a result to multiple inputs. With the introduction of machine learning, interpretability became more difficult as the formulae became more complex, capturing complex effects and interactions between inputs. This led many to despair that machine learning was doomed to be black-box technology and that the only choice was between accuracy versus interpretability.
The modern AI-driven organization does not choose between accuracy and interpretability of predictions. It wants and needs both accuracy and interpretability. Its business staff want actionable insights (e.g., why a specific customer is likely to churn). With the trust and buy-in of those business staff, AIs would not have been accepted within the broader business. Increasing consumer activism and regulatory restrictions mean that organizations must explain algorithmic decisions as they affect their customers. The modern AI-driven organization achieves this by using the latest generation of AI, which explains its decisions in a human-friendly manner, accessible to data scientists and business people alike.
Prediction Explanations
The insights and diagnostics described in this blog series were about the big picture, the model in total. But data analysts want insights into individual customers. Marketers want to align campaign messaging with the reasons why customers were selected for the campaign by an algorithm. Business staff want to see detailed worked examples to check against business rules and common sense. For these purposes and more, DataRobot has prediction explanations. A prediction explanation tells us which input features caused a prediction to have its value. Prediction explanations are best at explaining why a data point has a prediction that is different from a typical prediction by considering two aspects of that data point:
- What is different about this data point versus a typical data point?
- How does that difference in data values change the prediction versus a typical prediction?
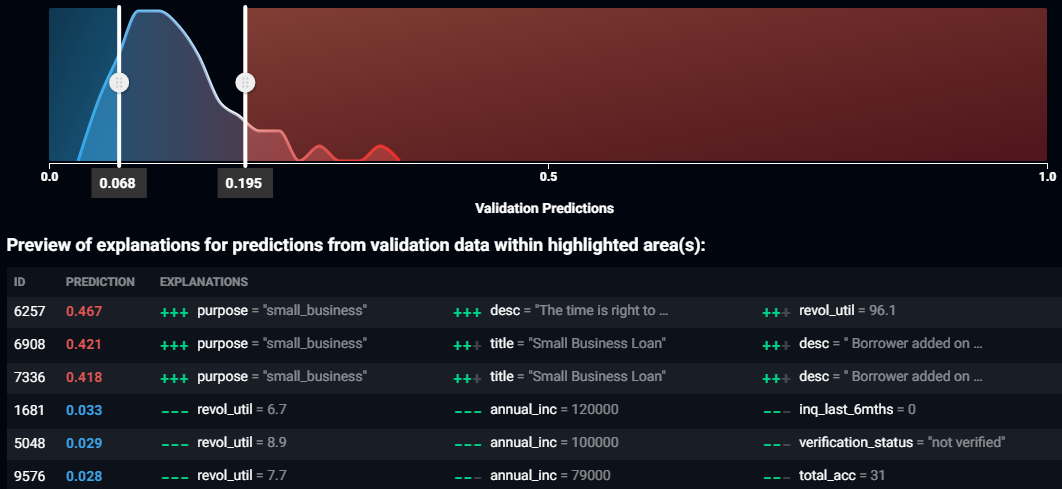
Above is a screenshot of the prediction explanations for a complex algorithm trained on Lending Club’s loan data, used to predict which loans will go bad.
The plot above the table shows the distribution of predictions for the dataset. Blue indicates low predictions and red indicates high predictions. The two sliding ranges define the prediction ranges for which prediction explanations will be calculated. Since prediction explanations are computationally intensive and designed to explain why a prediction is higher or lower than average, the sliding ranges default to only show explanations for very high and very low predictions. You can change which explanations are calculated by moving the sliders – to obtain explanations for all data points, just move the sliders so that they touch.
The table below the plot gives six examples of prediction explanations, showing three of the highest predictions and three of the lowest predictions. If you want explanations for more rows, don’t despair, as prediction explanations are available for each and every row in the training data, and most importantly, prediction explanations are available for new data! ID is the row number in the training dataset. Prediction is the predicted value, a probability for classification projects, an amount for regression projects. Following the prediction are the values of the three input features that have the greatest effect upon the prediction and their relative strengths. The input features with the greatest effect upon the prediction are on the left, and the ones with the weakest effects are to the right of the table. Green plus signs indicate that the input feature caused the prediction to be higher, and the number of plus signs indicates the relative strength of that effect. Similarly, red minus signs indicate that the input feature caused the prediction to be lower.
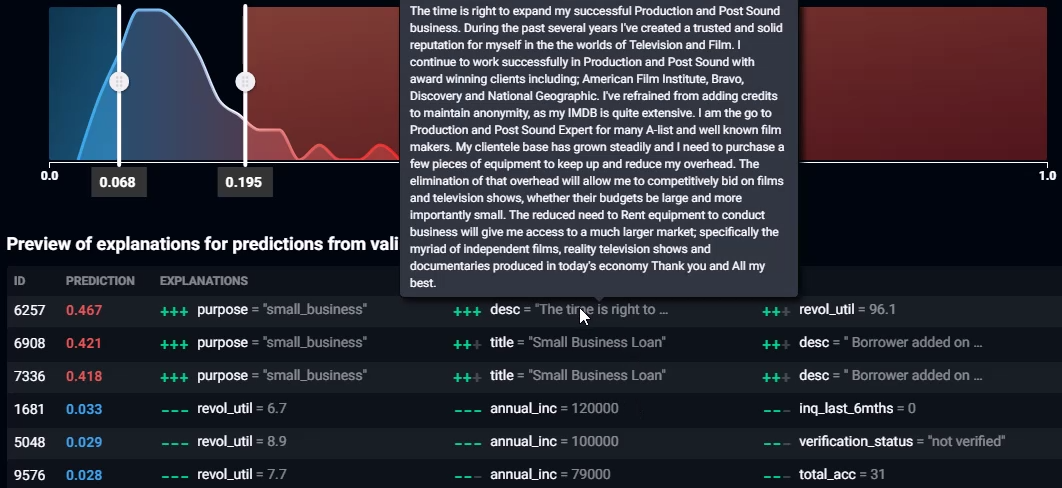
Placing the mouse over a feature value will show a window displaying the full contents of that input feature. In the screenshot above, you can see a loan description text feature that describes how the loan applicant wants to borrow money to fund a new business that films documentaries.
How to Interpret the Prediction Explanations Above:
- The top row, with ID 6257, has a high probability of the loan going bad because the loan is for a small business, the borrower wants to use the money to film documentaries, and because the borrower’s line of credit facility is already 96.1% of its limit. All three of these input features increase the probability of default and have two to three plus marks against them, indicating that the effects are material. We can apply business knowledge and common sense to confirm that this prediction makes sense and craft a narrative, as the borrower has already borrowed close to their limit and wants more money to fund a business that is unlikely to make a profit.
- The row third from the bottom, with ID 1681, has a low probability of the loan going bad because the borrower has 6.7% utilization of their line of credit facility, an annual income of $120,000, and zero inquiries in the past six months. All three of these three input features reduce the probability of default, and have two to three minus marks against them, indicating that the effects are material. We can apply business knowledge and common sense to confirm that this prediction makes sense and craft a narrative, as the borrower is a high-income earner who has hardly used their line of credit facility and hasn’t been actively borrowing money.
Conclusion
The path to trusting an AI includes knowing whether the way it is using the data is suitable and reasonable. The path to building an AI involves training multiple machine learning algorithms to find the one that best suits your needs, and the only practical way for you to quickly find the model that is suitable is to use automated machine learning, which generates the prediction explanations for each and every data point, for each and every model. If your AI is a black box that can’t explain the predictions and decisions that it makes, then it’s time to update to DataRobot for AI that you can trust. Click here to arrange for a demonstration of DataRobot’s human-friendly insights, showing how you can trust an AI.

Colin Priest is the VP of AI Strategy for DataRobot, where he advises businesses on how to build business cases and successfully manage data science projects. Colin has held a number of CEO and general management roles, where he has championed data science initiatives in financial services, healthcare, security, oil and gas, government and marketing. Colin is a firm believer in data-based decision making and applying automation to improve customer experience. He is passionate about the science of healthcare and does pro-bono work to support cancer research.
-
How to Choose the Right LLM for Your Use Case
April 18, 2024· 7 min read -
Belong @ DataRobot: Celebrating 2024 Women’s History Month with DataRobot AI Legends
March 28, 2024· 6 min read -
Choosing the Right Vector Embedding Model for Your Generative AI Use Case
March 7, 2024· 8 min read
Latest posts
