


How DataRobot Can Help Actuaries Build And Interpret Pricing Models
Accurate pricing is essential to protecting an insurance company’s bottom line. Pricing directly impacts the near-term profitability and long-term health of an insurer’s book of business. The ability to charge more accurate premiums helps the company mitigate risk and maintain a competitive advantage, which, in turn, also benefits consumers.
The methods actuaries use to arrive at accurate pricing have evolved. In earlier days, they were limited to univariate approaches. The minimum bias approach proposed by Bailey and Simon in the 1960s was gradually adopted over the next 30 years. The later introduction of Generalized Linear Models (GLM) significantly expanded the pricing actuary’s toolbox.
Over time, the limitations of GLM have driven pricing actuaries to research new, more advanced tools. As AI and machine learning gradually revolutionize industries, including insurance, actuaries are increasingly recognizing the value of AI and machine learning. (For more on this, see the following blog post.)
DataRobot is an AI and machine learning platform that is used across many industries and use cases. When it comes to insurance and loss cost modeling, DataRobot enforces best practices by automating model setup and incorporating various preprocessing and modeling approaches. Pricing actuaries can test various advanced algorithms with minimal setup, including XGBoost, GBM, ENET, and GAM. Within the same project, they can also try common loss cost modeling approaches such as frequency-severity models, pure premium models, and frequency-cost models. All features are designed to increase the efficiency and accuracy of insurance loss cost modeling.
Loss cost modeling-related features
Exposure
It is common to take exposure into account when modeling insurance loss cost. Exposure is a measure of the unit of risk for an insurance policy. For example, a car-year is a reasonable measure for personal auto insurance, while a home-year could be an exposure for homeowners insurance. For commercial insurance such as General Liability, exposure could be more involved. Generally, it’s reasonable to expect a policy with greater exposure to be associated with higher expected losses, all else being equal. In DataRobot, the modeler can enter the exposure variable as Exposure, which is processed appropriately by DataRobot during the modeling process (see Graph 1).

Claim Count
Frequency-severity and pure premium are the common types of insurance loss cost models.
To build a frequency-severity model, relevant claim counts have to be specified. Claim count indicates the number of claims that were filed during a specific exposure period. For example, if no claim was filed for a particular policy, the claim count will be 0. Claim count will be 1 if there was one claim during the exposure period.
Claim count may not be most important for personal lines loss cost modeling. However, it is critical for commercial lines, such as workers compensation insurance, where multiple claims may be filed for a policy during the same policy period (or exposure period).
Count of Events can be specified as one of the settings in DataRobot (see Graph 2). When Count of Events is not provided, DataRobot will, by default, build a binary classification model as the frequency model.

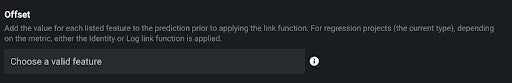
Offset
Offset introduces additional flexibility to loss cost modeling. This feature is useful when a pricing actuary would like to evaluate the lift of additional features on top of the existing pricing model. In certain instances, a pricing actuary may want to leverage industry indications for some features and model on other features using proprietary data. For both scenarios, Offset can be used to incorporate the effects of those features that the actuaries don’t want to model on.
In DataRobot, a single feature or multiple features can be specified as Offset (see Graph 3). In addition, DataRobot will only pull in algorithms that are compatible with these features, so actuaries don’t have to waste time checking to see which algorithms might work.
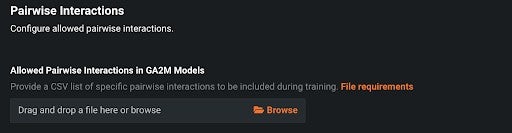
Interactions + customer-controlled interactions
Pricing actuaries are increasingly recognizing the importance of interactions and are incorporating them in their pricing models. DataRobot offers multiple approaches for interaction discovery. For those who are familiar with GLM outputs, DataRobot’s proprietary algorithm, Generalized Additive 2 Model (GA2M), not only produces a rate table with a similar format as GLM but also automatically surfaces all the important pairwise interactions. It also allows pricing actuaries to use their domain knowledge to determine which interaction terms to include in their pricing models (see Graph 4).
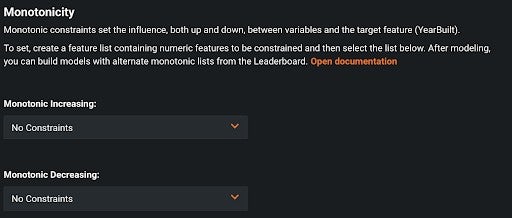
Monotonic constraints
Sometimes it’s helpful to restrict model estimates to increasing or decreasing. A good example of this is Coverage A Amount (similar to property value) for homeowners insurance. It would be reasonable to expect the owner of a property of greater value to pay a higher insurance premium than the owner of a property of lesser value. In DataRobot, it’s possible to specify any number of features that this monotonic increasing or decreasing constraint should be applied to (see Graph 5).
Model interpretation-related features
Besides modeling loss costs to understand what drives them, pricing actuaries are also required to communicate with various stakeholders including, but not limited to, senior management, underwriters, and regulators. No tools can eliminate the important work performed by pricing actuaries when it comes to explaining model results and preparing supporting documents for filing. DataRobot makes this critical work much easier by providing various exhibits, such as feature importance, feature effect, prediction explanation, rating tables, and compliance documentation.
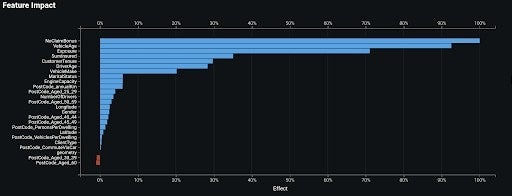
Feature Impact
The Feature Impact plot shows which features are important to a model and ranks the features in terms of their relative importance. In the plot below (Graph 6), NoClaimBonus is the most important feature, followed by VehicleAge.
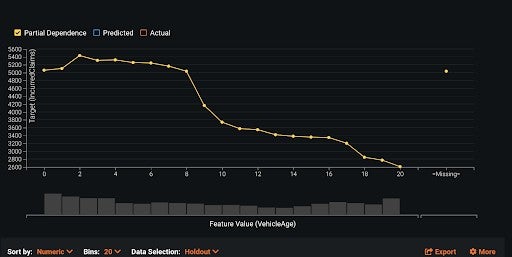
Partial Dependence
The Partial Dependence plot indicates how each feature drives model predictions. The plot below (Graph 7) for VehicleAge clearly shows that older vehicles are associated with lower predicted loss cost. Businesses can check these plots to ensure that they only include features in the model that make business sense.
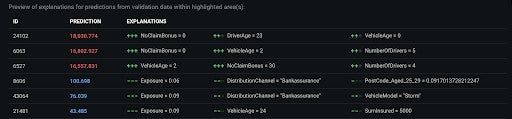
Prediction Explanation
Prediction Explanation helps clarify how each prediction is made in terms of the most important features. DataRobot allows up to 10 explanations for each prediction. Explanations at this level help increase confidence in the model.
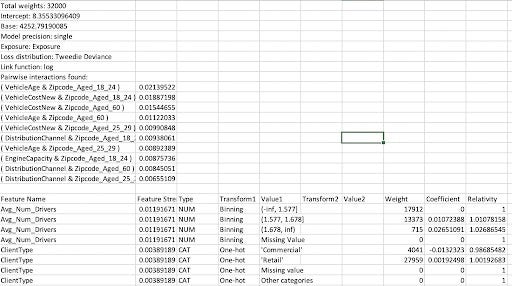
Rating tables
Rating tables provided by DataRobot have a similar format (Graph 9) as GLM output. Numeric features are grouped into bins and both model coefficients and relativities are provided. Pricing actuaries can use their judgment to adjust model estimates so that final rating factors can be generated. In addition, DataRobot allows the pricing actuary to upload the modified rating table to the same project. A separate model can be created based on the uploaded rating table. The actuary can then choose to deploy the model or compare model performance with other models in the same project.
Compliance documentation
Compliance documentation is an important part of model governance and risk management, especially for highly regulated industries such as insurance. DataRobot automatically generates customized compliance documentation for every model it develops. The report provides evidence to show that the components of the model work as intended, the model is appropriate for its intended business purpose, and the model is conceptually sound. These reports streamline the regulatory filing process.
Conclusion
The insurance market has become more competitive as carriers increasingly turn to advanced algorithms to refine their underwriting and pricing strategies. It is the pricing actuary’s responsibility to explore and use the appropriate algorithms to ensure the competitiveness of their pricing plan. Loss cost modeling can be very involved, given that pricing actuaries may need to evaluate the changes to exposures, mix of business, claim frequency, and severity. An automated machine learning platform with insurance-related features like DataRobot can help facilitate this process. To learn more about how to build loss cost models using DataRobot, see DataRobot’s library of use cases.

Quncai Zou, FCAS, MAAA, CPCUCurrently an actuarial data scientist with DataRobot with more than 10 years’ experience in insurance industry, including pricing and reserving for both personal and commercial lines using both traditional actuarial methods and advanced analytics. Led the efforts of predictive analytics at various insurance companies and successfully delivered pricing / underwriting / reserving / marketing / claims models for personal auto, homeowners, commercial auto and workers comp lines of business.
-
How to Choose the Right LLM for Your Use Case
April 18, 2024· 7 min read -
Belong @ DataRobot: Celebrating 2024 Women’s History Month with DataRobot AI Legends
March 28, 2024· 6 min read -
Choosing the Right Vector Embedding Model for Your Generative AI Use Case
March 7, 2024· 8 min read
Latest posts
