

Exploring Model Insights in DataRobot
This post was originally part of the DataRobot Community. Visit now to browse discussions and ask questions about DataRobot, AI Platform, data science, and more.
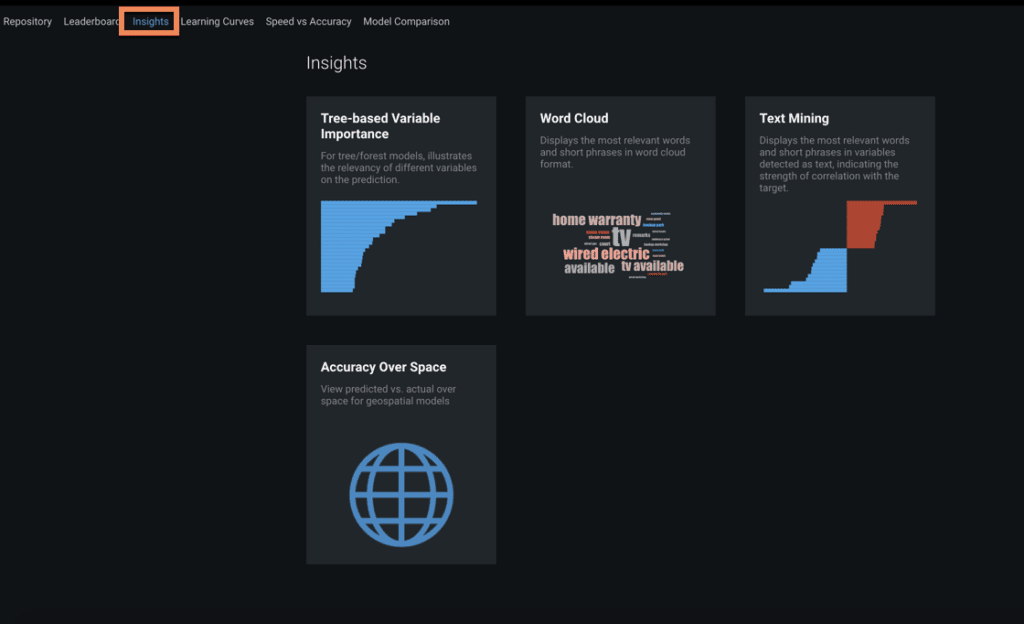
The Models > Insights tab provides several additional graphical representations of model details. Some are model agnostic and applicable to any model or the data as a whole, while others are representations of model details that apply to a particular model that you select.
- Tree-based Variable Importance provides a ranking of the most important variables in a model by using techniques specific to tree-based models.
- Hotspots indicate predictive performance as a set of rules—the rules being combinations of feature values of a subset of important features.
- Variable Effects illustrate the magnitude of existing and derived features by way of coefficient values.
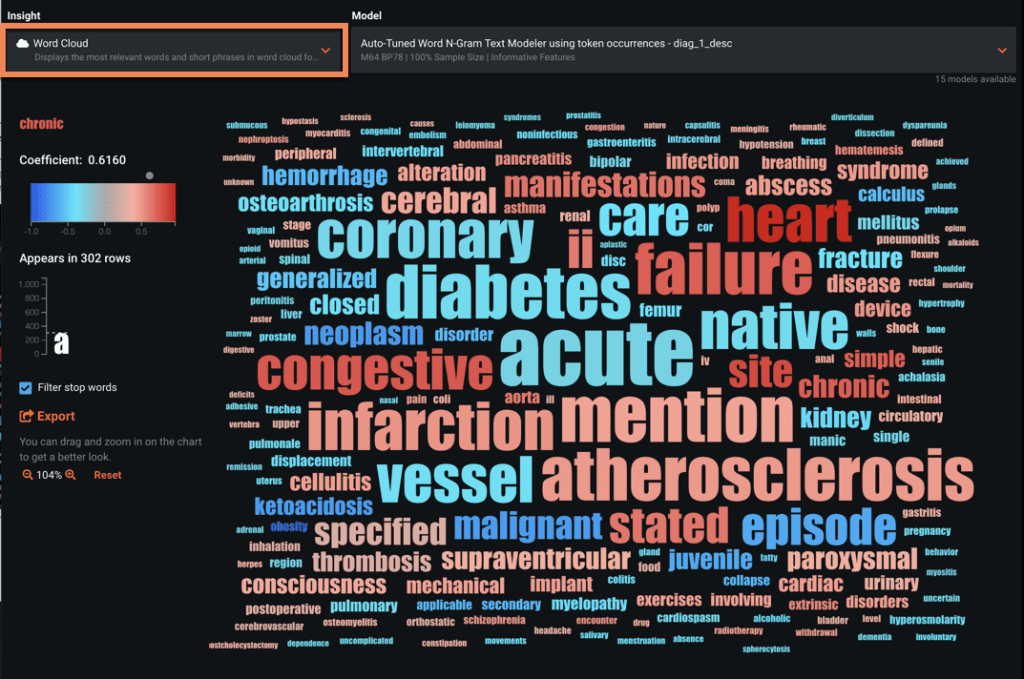
- Word Cloud visualizes the relevance of text related to the target variable
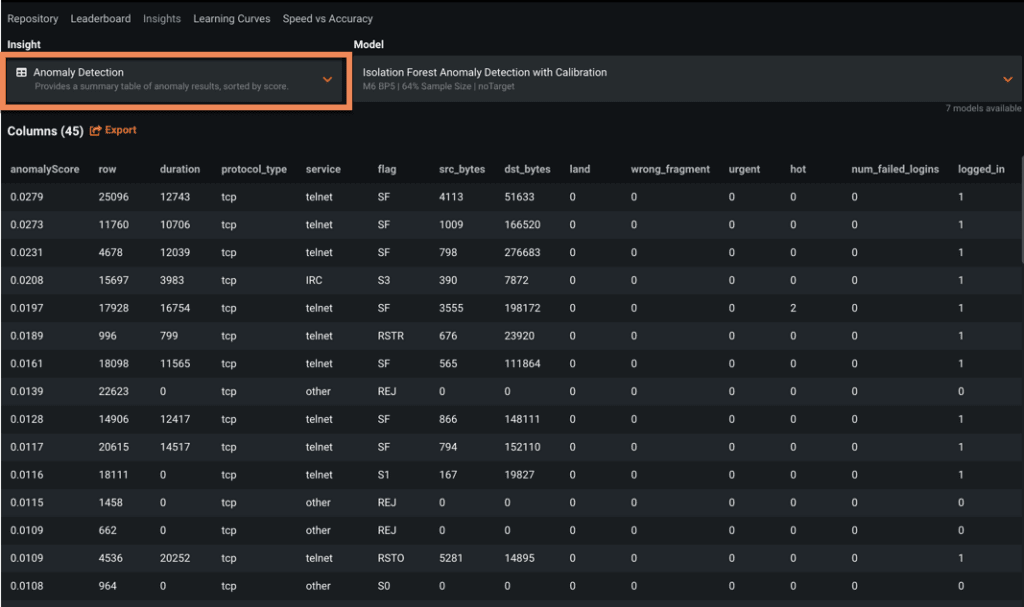
- Anomaly Detection provides a summary table of anomalous results sorted by a scoring of the most anomalous rows.
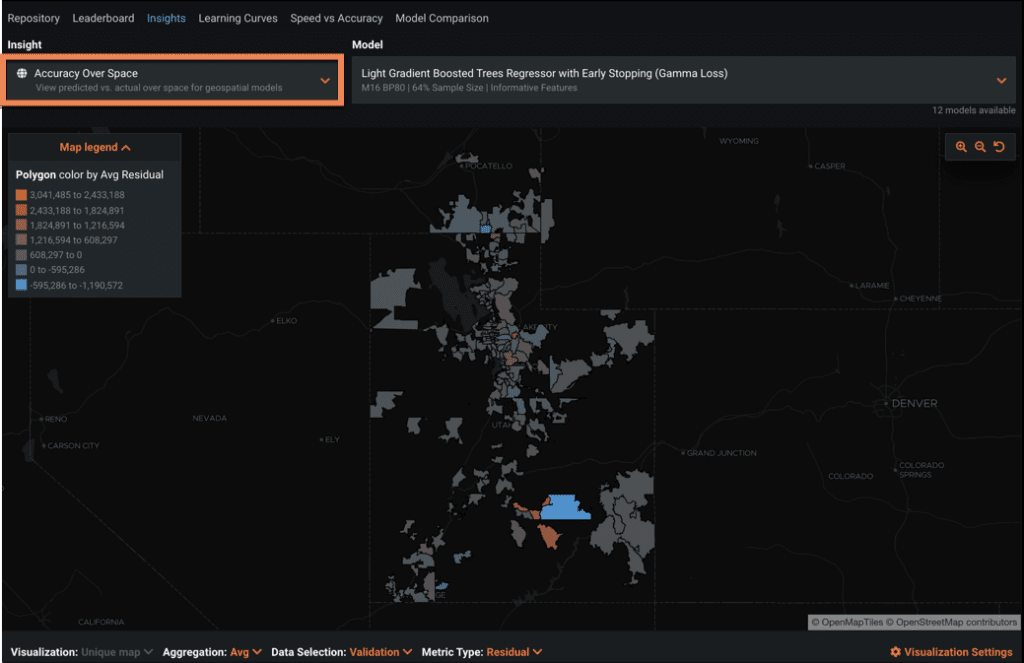
- Accuracy Over Space provides a visualization for how predictions change over time for Regression projects.
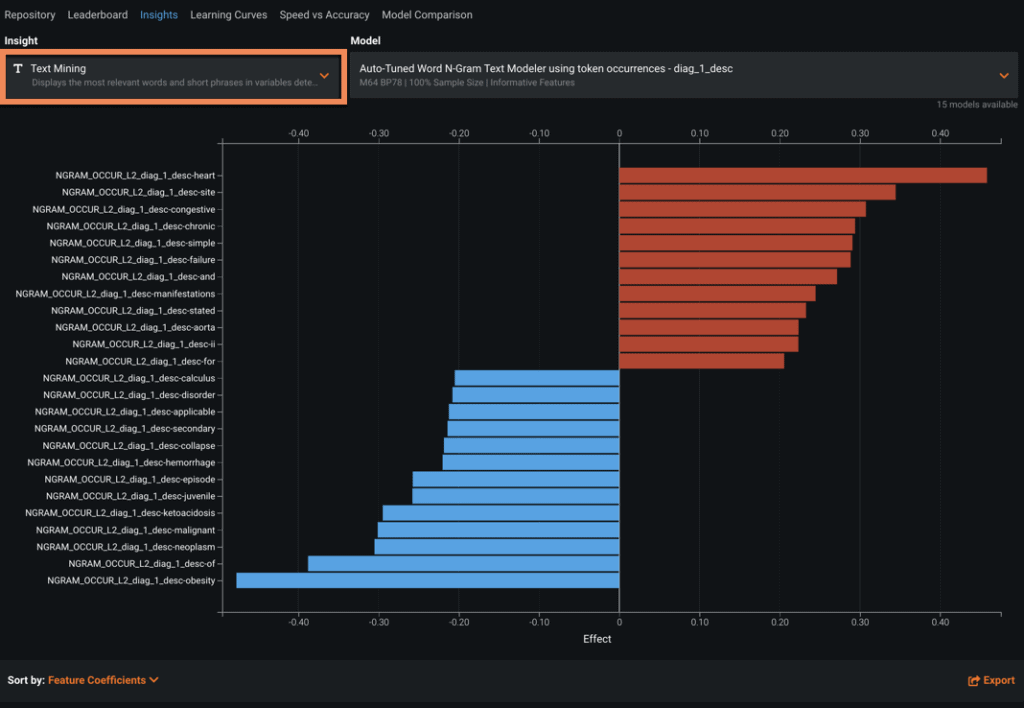
- Text Mining, similar to Variable Effects, visualizes the relevancy of words and short phrases, and also by way of coefficient values.
Now let’s take a look at each in greater detail.
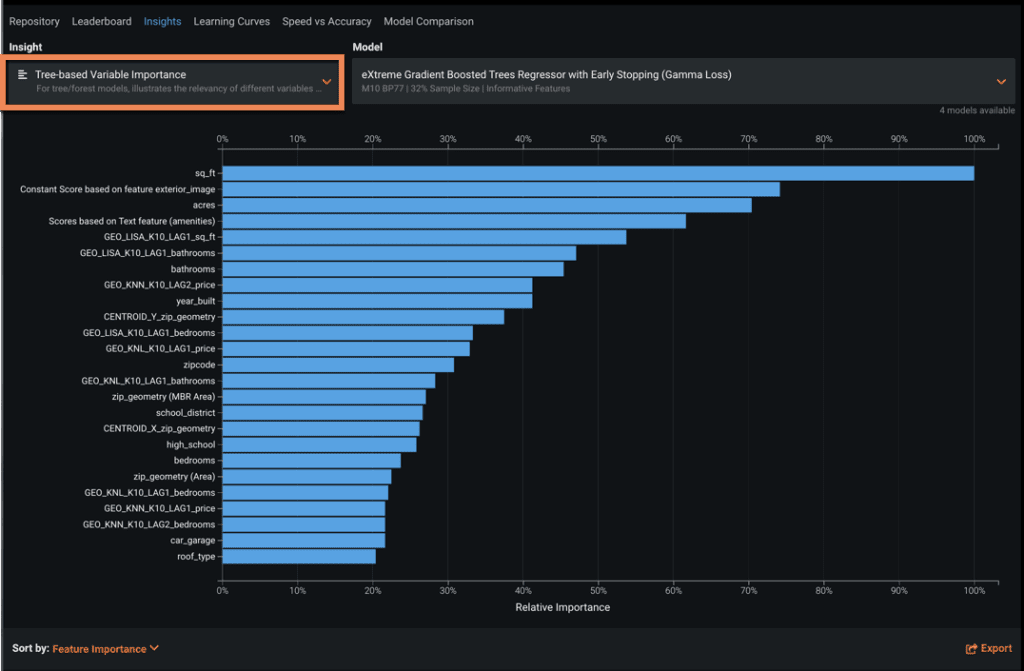
Tree-Based Variable Importance
Tree-based Variable Importance shows the sorted relative importance of all key variables driving a specific model, relative to the most important feature for predicting the target. In models based on random forests, this can be derived using entropy or Gini calculations, which are based on measurements of impurity or information gain.
In the dropdown list shown in Figure 2 are all tree-based models in the project, and each is available to be selected and displayed. This is helpful to quickly compare models. It is useful to compare how feature importance changes for the same model with different feature lists. Generally, we recommend using Feature Impact to understand a model, but tree-based variable importance may provide insights.
For example, a feature that is recognized as important on a reduced dataset might differ substantially from the features recognized on a full dataset. Or if a feature is included in only one model out of the dozens that DataRobot builds, it may not be that important. If this is the case, excluding it from the feature set can optimize model building and feature predictions.
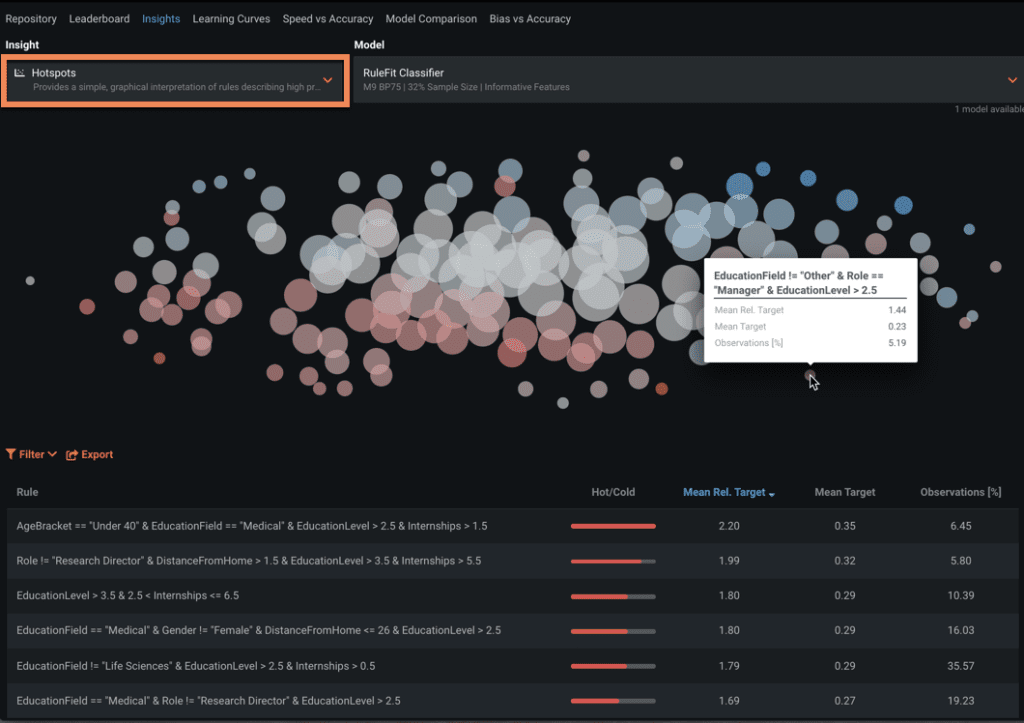
Hotspots
This investigation tool shows hot spots and cold spots which represent simple rules with highly predictive performance either in the direction of the target, which is a hot spot, or in the opposite direction of the target, which is a cold spot. These rules are often good predictors and can be easily translated and implemented as business rules.
Note that Hotspots are available when you have a rule fit classification or regression model, requiring at least one numeric feature and fewer than one hundred thousand features.
In Figure 3, we see the size of the spot, which indicates the number of observations that follow the rule, and the color of the spot, which indicates the difference between the average target value for the group defined by the rule and the overall population.
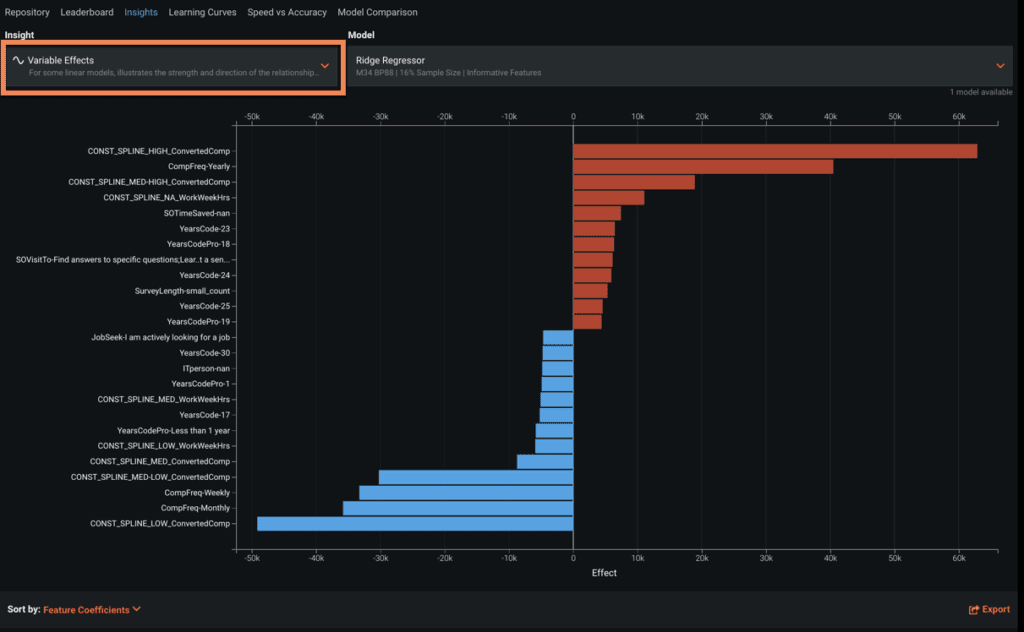
Variable Effects
Variable Effects tells us the relevance of different variables, many derived from raw features in the model. The variable effects chart shows the impact of each variable in the prediction outcome. Notably, this chart is useful to display and compare variables via different constant splines from applicable linear models. This is useful to ensure that the relative rank of feature importance across models doesn’t vary wildly. If in one model, a feature is regarded to be very important, but in another model it is not very important, then it’s worth double-checking both the dataset and the model with Variable Effects.
You can sort the Variable Effects by the dropdown menu at the bottom by coefficient value or alphabetically by feature name.
Word Cloud
This tool displays the most relevant words and short phrases in a word cloud format. The size of the word indicates its frequency in the dataset and the color indicates its relationship to the target variable.
Text features can contain words that are highly indicative of a relationship to the target variable. You can use the Word Cloud to easily view and compare text based models in the dropdown list, but it’s also available in the Leaderboard for a specific model via the Understand division.
Anomaly Detection
Also referred to as outlier and novelty detection, Anomaly Detection is an unsupervised method for detecting abnormalities in your dataset. Similar to supervised learning, anomaly detection works on historical data, but is unsupervised in that it does not take the target into account when making predictions. DataRobot does this by simply ignoring the target when building anomaly models.
Because you still do enter a target, however, DataRobot also can build accurate non-anomalous models. (Anomaly detection will be discussed in greater detail in a future article.)
Accuracy Over Space
Accuracy Over Space provides a spatial residual mapping, enabling you to assess model fidelity for a selected model. It provides similar visualizations to Location AI ESDA (Exploratory Spatial Data Analysis), but allows you to explore prediction error metrics across all data partitions.
Text Mining
Lastly, the Text Mining chart displays the most relevant words and short phrases in any features detected as text. Like Variable Effects, you can use the dropdown list at the bottom of the page to sort by coefficient value or alphabetically by feature name.
More Information
Find out more about the insights available in DataRobot by visiting our public documentation portal and navigating to the Insights section.

-
How to Choose the Right LLM for Your Use Case
April 18, 2024· 7 min read -
Belong @ DataRobot: Celebrating 2024 Women’s History Month with DataRobot AI Legends
March 28, 2024· 6 min read -
Choosing the Right Vector Embedding Model for Your Generative AI Use Case
March 7, 2024· 8 min read
Latest posts
