


End-to-End Bias Evaluation with DataRobot
As AI has become more ubiquitous, we’ve started to see increasingly more examples of AI behaving badly. Recent high-profile examples include hiring models that are biased against women and facial recognition systems that can’t identify black individuals. At DataRobot, we want to ensure that users have the right tools at their disposal to investigate bias. To meet that goal, we created our Bias and Fairness capabilities, allowing you to test your models for bias, understand the root cause, and monitor deployed models for biased behavior over time. In this post, we’ll walk you through an example of how to use DataRobot’s full suite of bias and fairness capabilities for end-to-end bias evaluation.
The Data
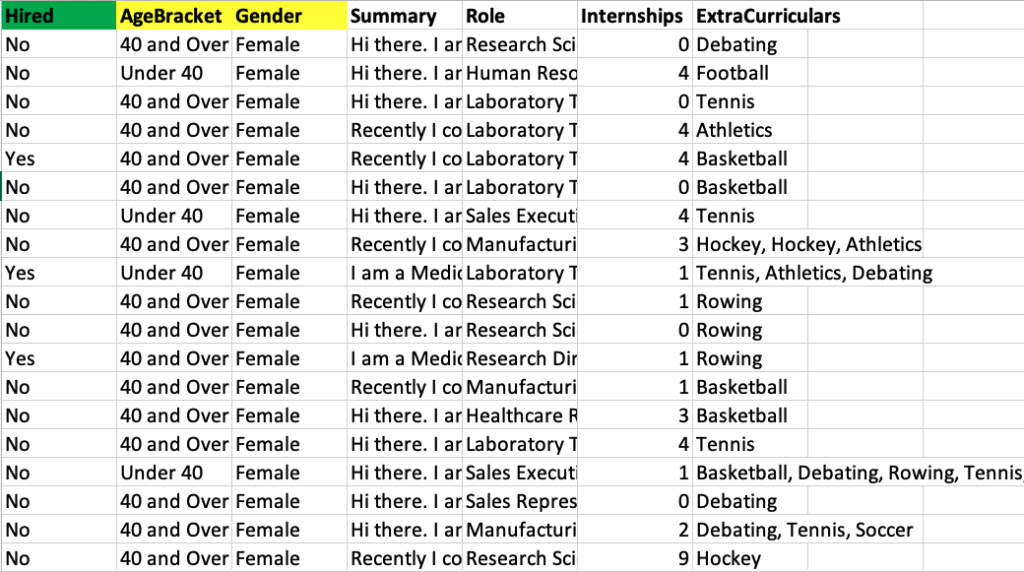
We’ll be using a dataset that contains job applications and training a model to predict if the candidates were hired or not. The green column is our target, and the yellow columns are Protected Features, or features we want to examine for model bias.
Checking Models for Bias
To begin using Bias and Fairness Testing in DataRobot AutoML, we first need to set it up. If you would like to follow along you can watch our Bias and Fairness Testing demo recording.
Selecting Protected Features You Want to Evaluate for Biased Behavior Against
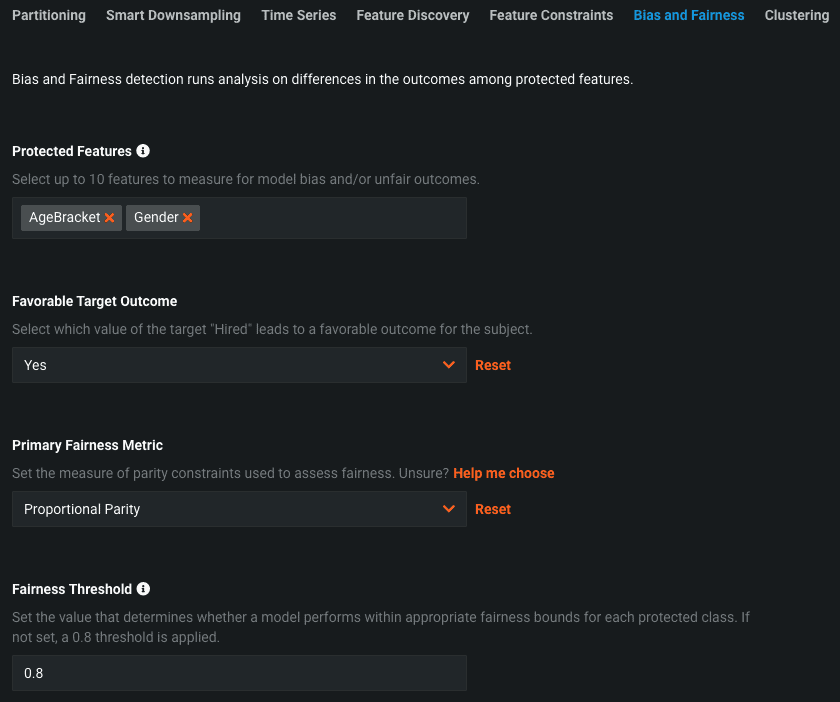
We start by selecting the Protected Features. In many countries and industries, these features are protected by law and often include gender, age, and race. In the above example, we’ve selected AgeBracket, which denotes whether a particular applicant is above or below 40 years old, and Gender.
Choosing a Fairness Metric to Define Bias
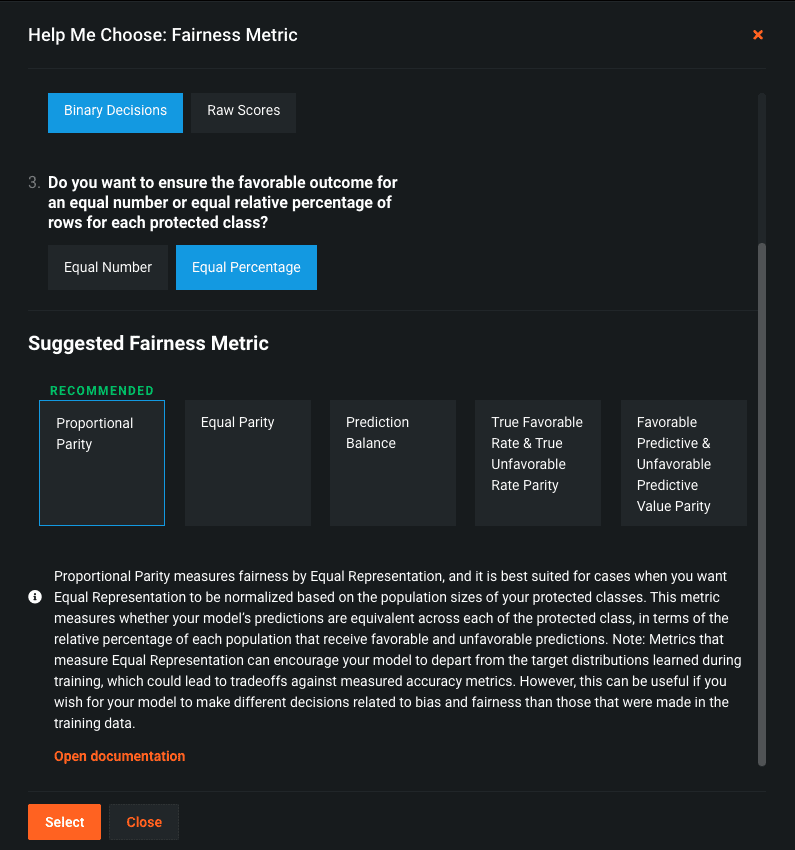
There are many different ways to measure bias in models. Deciding which one to use can depend on your use case. In some cases you might be interested in the proportion of classes that received a certain outcome, and in other cases you might be interested in the model’s error rate across those classes. DataRobot offers five industry standard Fairness Metrics to measure bias and provides in-depth descriptions of each. If you’re unsure which one to use, there’s a helpful workflow to help guide you toward an appropriate metric. In this case, we’ve selected Proportional Parity, which looks at the percentage of records that receive the favorable outcome. You can see an example of someone walking through this workflow in the demo video here.
After we have configured Bias and Fairness, we can begin building models.
Evaluating Bias by Using Per-Class Bias
After models have been built, we can begin evaluating them for bias using the Per-Class Bias insight.
There are two views to this plot. Selecting Show absolute values shows us the raw Fairness Scores computed for each class. Selecting Show relative values shows us the Fairness Scores scaled to the most favored class. A class being below the Fairness Threshold is determined by its relative value. For example, if 10 men are hired and only 6 women, men would receive a relative Fairness Score of 1 and women a relative Fairness Score of 0.6. If our Fairness Threshold is 0.7, women would be below the Fairness Threshold and highlighted red in Per-Class Bias.
In the example above, we see each of the classes in the Protected Feature Gender. The class Women is red, which means it is below the Fairness Threshold of 0.8 and the model is behaving in a biased manner toward it. To put this into the context of our use case, the model is recommending that women be hired at a ratio of less than 0.8 to that of men.
Determining the Causes of Bias
After biased model behavior has been discovered, the next question is “why is the model behaving this way?” Often biased behavior is caused by differences in your features between classes in a Protected Feature. The Cross-Class Data Disparity insight can help you discover these differences.
Discovering Causes of Bias by Using Cross-Class Data Disparity
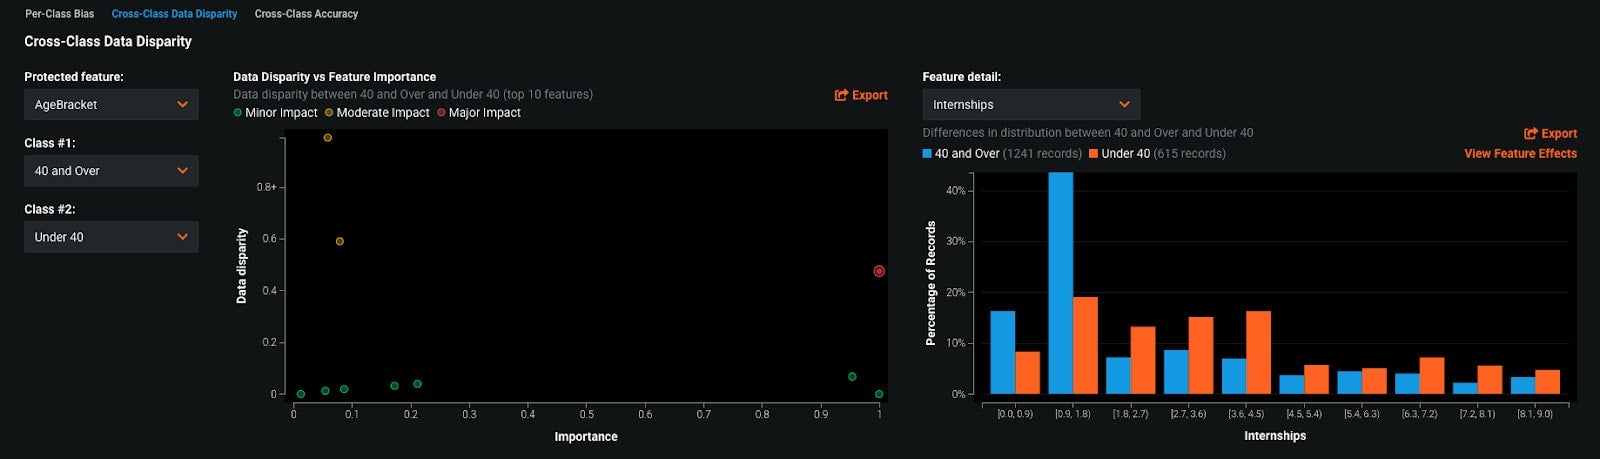
In the example above, we’re looking at the other Protected Feature in our use case, AgeBracket. On the left, we’re examining the feature differences between the two classes in AgeBracket: 40 and Over and Under 40. The Data Disparity vs Feature Importance plot shows us the data disparity between these two classes for each feature in our dataset plotted against the feature’s importance. Features that exhibit a high degree of disparity and are highly important (features in the top right quadrant) are of especial interest. The feature Internships meets this criteria and has been selected. It is shown in the Features Detail plot. This tells us how exactly the values of Internships differ between the two classes, 40 and Over and Under 40. Individuals 40 and over have more internships in the 0-2 range, and individuals under 40 have more than 2 internships. Because Internships is a very important feature in our model, this difference might be a reason the model is recommending individuals 40 and over and under 40 be hired at different rates.
To see how we determine the root cause of bias for this exact use case you should watch the demo video segment here.
Monitoring Deployed Models for Bias
So far we have discussed how you configure and test your model for bias at training time. However, a model might not have bias when you develop it, but bias could emerge over time after it has been deployed. Bias Monitoring is a feature of DataRobot’s MLOps platform and can be used after you start uploading actuals to a deployment.
Setting Up Bias Monitoring
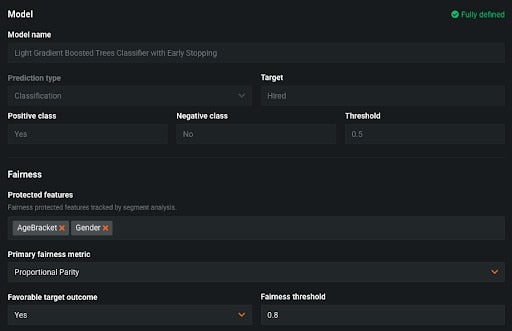
Bias Monitoring is configured in the same way as in AutoML. We define our Protected Features and select the Fairness Metric we would like to use to define bias.
Monitoring Bias over Time
In the above example, we’ve created a deployment for our hiring model and sent data to it for scoring. We’ve also uploaded the actual response for each row we sent for scoring, which is required for Bias Monitoring. MLOps allows us to view the Per-Class Bias plot for each day since we created the deployment. At the beginning of the deployment, the model was not biased toward Gender. However, over the course of a few weeks, it began to exhibit biased behavior toward the women. This is evidenced by the class Women being below the bias threshold and the badge Below Threshold next to the class label.
Understanding How Bias Could Emerge by Using Data Drift
Much like how we used Cross-Class Data Disparity to understand why the model could be biased, we can use the MLOps feature Data Drift to understand if the data used for scoring differs from the data used for training. Data Drift in the model’s features could explain the emergence of bias.
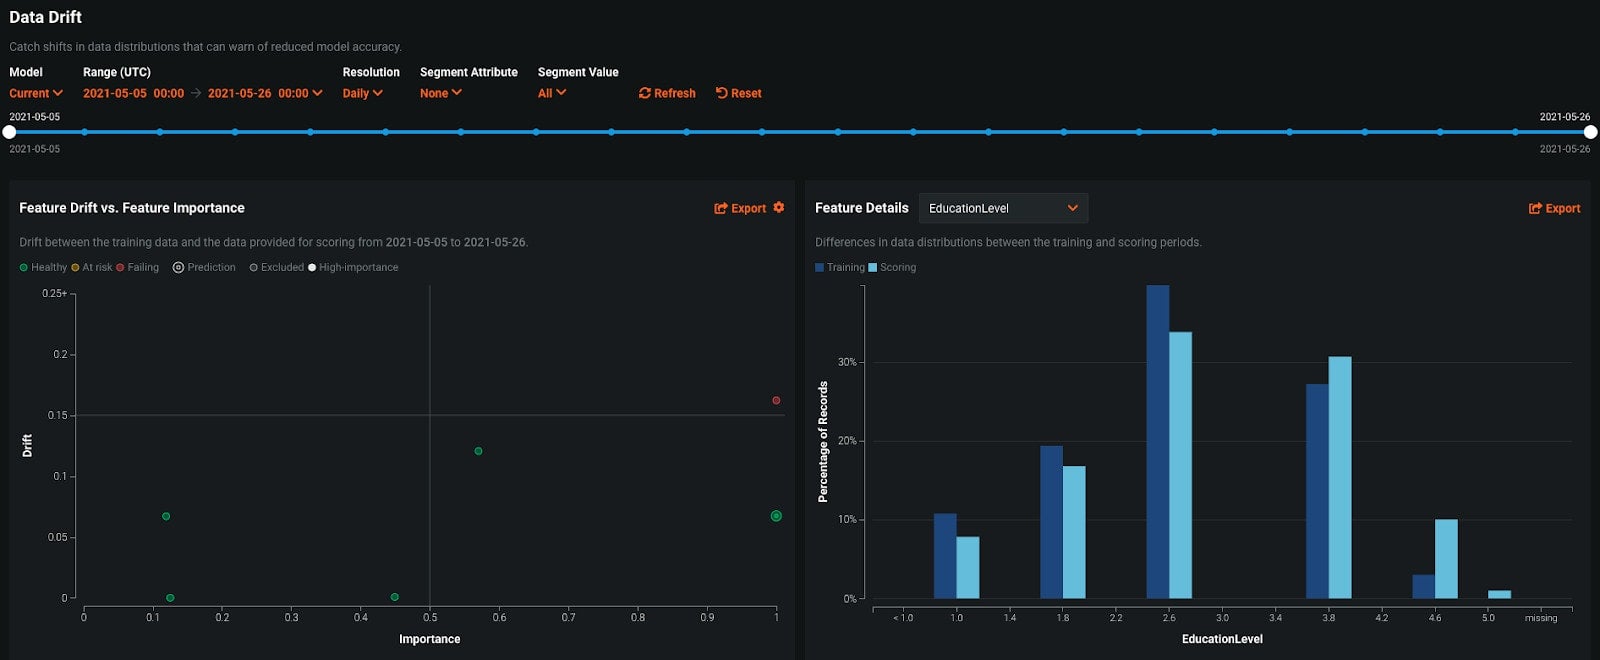
Looking at the Feature Drift vs Feature Importance plot shows us the extent to which features have drifted plotted against their importance. Features that have drifted a lot and that are very important (features in the top right quadrant), could contribute to biased behavior. The feature EducationLevel meets this criteria and has been selected. Looking at the Feature Details plot, we can see that lower levels of education were more prevalent in the training data and higher levels of education more frequently appear in the scoring data. This difference could be one insight in the emergence of bias over time.
Conclusion
Trust in AI models needs to be ensured at all steps of the model lifecycle from data to value. DataRobot’s end-to-end Bias and Fairness capabilities help you check models for bias, diagnose the causes of bias, and monitor deployed models for the emergence of bias over time.

Natalie Bucklin is the Senior Product Manager of Trusted and Explainable AI. She is passionate about ensuring trust and transparency in AI systems. In addition to her role at DataRobot, Natalie serves on the Board of Directors for a local nonprofit in her home of Washington, DC. Prior to joining DataRobot, she was a manager for IBM’s Advanced Analytics practice. Natalie holds a MS from Carnegie Mellon University.
-
How to Choose the Right LLM for Your Use Case
April 18, 2024· 7 min read -
Belong @ DataRobot: Celebrating 2024 Women’s History Month with DataRobot AI Legends
March 28, 2024· 6 min read -
Choosing the Right Vector Embedding Model for Your Generative AI Use Case
March 7, 2024· 8 min read
Latest posts
