


3 Reasons to Ditch Excel for FP&A Data Consolidation & Validation
Financial Planning and Analysis (FP&A) business professionals are responsible for mapping out a company’s financial future. They transform company goals into actionable plans by analyzing the current state of financial management affairs, then take the time to create a roadmap plan that details how to reach the destination.
Creating those plans require ingesting massive amounts of data resources, aggregating, cleansing, and standardizing that data, and then performing analysis on the finished product. The insights that are a product of that analysis are the FP&A analysts’ stock and trade. Everything that leads up to that insight is a means to an end.
Yet most FP&A analysts & management spend the vast majority of their time on that preliminary work—reconciliation, analysis, cleansing, and standardization, which I’ll refer to here collectively as data preparation.
That’s because Microsoft Excel is still the go-to tool for performing all of that data prep. And while Excel is a very capable tool for certain operations, it throws too many roadblocks in the corporate financial planning and analysis analyst’s path to be considered adequate, let alone efficient.
Below, I’ll focus on three of those roadblocks, along with a brief explanation as to why Paxata is the obvious replacement. Finally, I’ll link to a free ebook resource detailing why Excel has outlived its usefulness when it comes to data preparation for modern enterprises.
1. Excel isn’t smart enough to lend a hand
Imperfect beings that we are, even the best analysts can’t detect every single anomaly, especially when we’re dealing with millions of rows of data. AI, on the other hand, doesn’t miss a thing.
Lucky for us, we don’t have to be perfect. Corporate FP&A analysts—and analysts of all stripes, for that matter—can now rely on AI to catch what we miss. But to do that, you’ve got to leverage tools that actually have artificial intelligence baked in. For tasks like these, Excel just won’t cut it anymore.
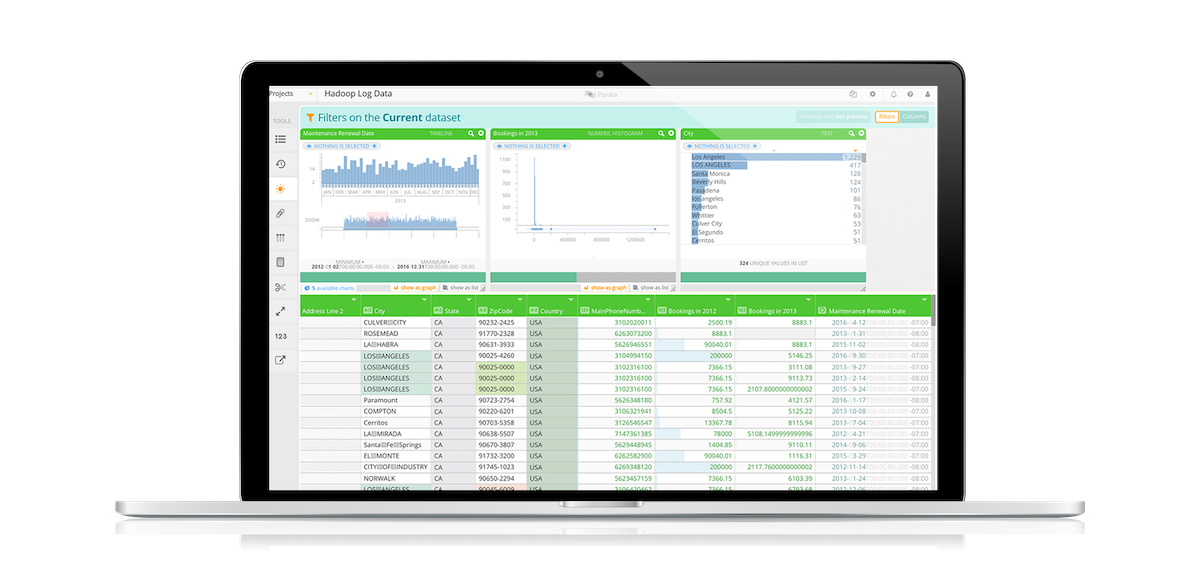
Profiling data
The hard way. Say you’re preparing budget vs actuals. In Excel, you create a pivot table to compare sales performance by region and salesperson. In this scenario, you’ll constantly switch back and forth between your pivot table and your filtered data to find duplicates and outliers, change values, or remove errors. And in the end, you still only have a partial understanding of what you’re looking at.
The easy way. Paxata’s Filtergrams—a combination of filters and histograms—provide a visual representation of your data before, during, and after every transformation. Not only is the data you’re looking for in a single view, it’s also embedded in an interactive, point-and-click interface that makes detecting anomalies a breeze.
Cleansing data – Financial Planning & Analysis Process
The hard way. In Excel, you’ll need to create nested formulas for even simple logic to clean your data.
The easy way. Paxata takes care of the heavy lifting involved in cleaning data in two ways. First, Paxata’s intelligent cleansing algorithms can be applied using built-in natural language processing. Next, Filtergrams hone in on specific values to apply your logic.
Combining & Blending Data – Financial Planning & Analysis Process
The hard way. Excel requires you to manually scan every column of your spreadsheet, keeping a mental tally of them as you go. Then, you’ll need to perform VLOOKUPs to merge them into your dataset. The bigger the data set, the trickier and more error-prone this process gets. (In fact, analysts spend roughly two-thirds of their time searching for data.)
The easy way. Maybe you’re preparing a cash flow forecast and need to merge two data sets. Paxata’s join detection algorithms can identify candidate columns such as these that could form the basis for joining two disparate data sets.
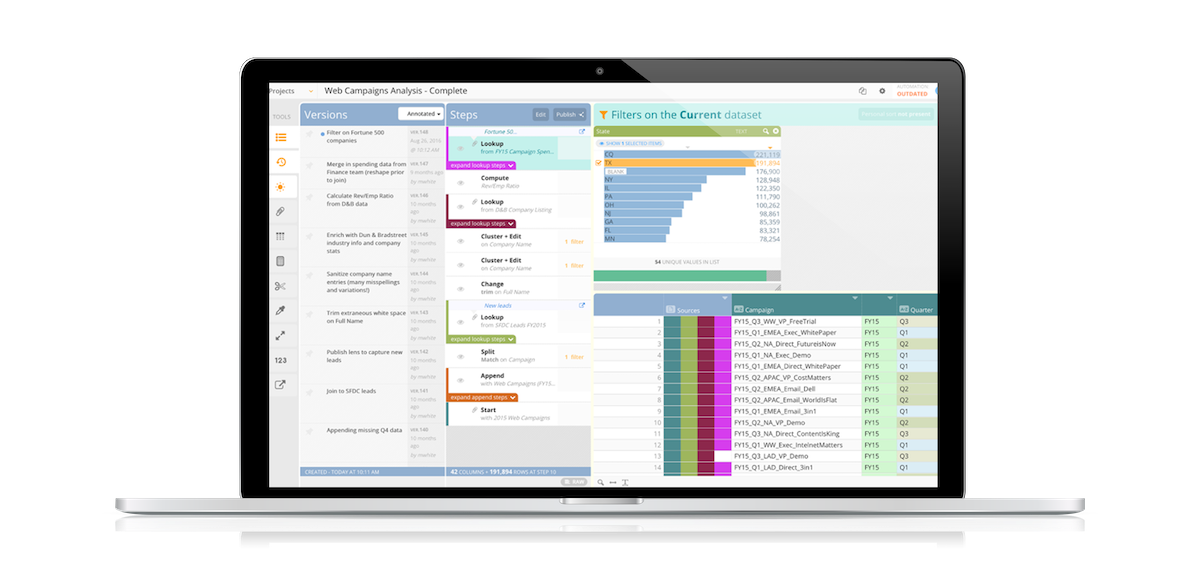
2. Excel requires coding knowledge to edit and reuse workflows
Paxata records every transformation you make, every step of the way, so you can easily re-run transformations in a specific order or time later.
Reusing workflows in Excel requires recording data macros or coding them in VBA. But let’s say you’re comfortable coding macros. What if you need to swap the order of two of the transformations in a given workflow?
Paxata handles this elegantly, allowing you to reorder each step in a simple, visual interface. You can even clone the entire process to reuse it on a different data set.
For FP&A folks, this can be invaluable. Forecasts & solutions are needed on a regular basis, after all. Sales patterns, headcount, and territories change, and each new piece of data breaks the model.
But thanks to Paxata’s point-and-click interface, you don’t need to recode a VLOOKUP to update your corporate model. Just drag the new data into the appropriate field, re-run the workflow, and you’re done.
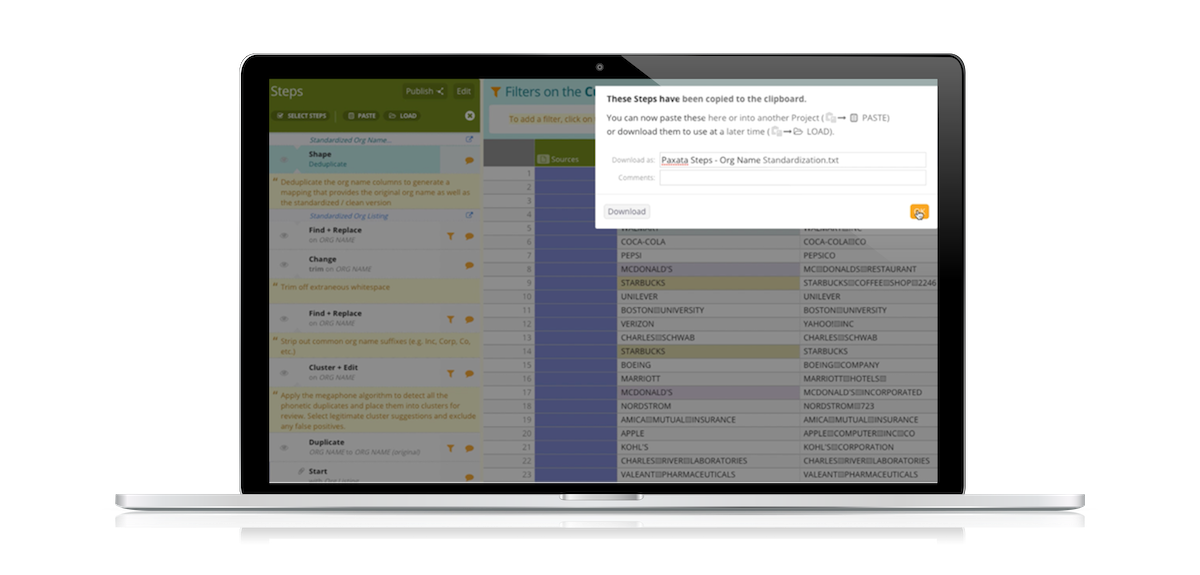
3. Excel doesn’t leave an audit trail
I mentioned that Paxata records every transformation. That not only makes for easy reuse, it also leaves a comprehensive audit trail. It’s hard to overstate the impact this can have organization-wide.
Recording every transformation means anyone with the proper tools, resources or permissions can access the data and see each transformation performed in their browser.
But that’s just the start.
Analysts can also annotate each step, allowing colleagues to, as Nationwide Business Information Architect Mark Marshalek put it, “start to see the mindset of the user who created the project or data environment.”
Then there’s ClicktoPrep. Within each project, you’ll find a ClicktoPrep link. Copy and paste that code into your BI tool of choice (like PowerBI). Selecting that link from within the BI tool takes you to the data prep project that transformed the data into the information visualized in your BI tool.
The extent of this data lineage in Paxata means no one ever has to guess how you arrived at a specific conclusion. It’s all laid out in black and white.
Moving to the assembly line model of data prep
As we’ve seen, Paxata can reduce (or virtually eliminate) tedious data preparation processes for the majority of FP&A analysts work. Budgets vs actuals, forecasting, revenue and expense reporting, product profitability reports, and compliance reporting are ushered into the 21st century with Paxata’s self-service data prep.
When the time-to-insight is reduced to a fraction of what it was, the effect on enterprise organizations is profound. A simple question from leadership that previously took days or weeks to answer can now be delivered the same day.
FP&A (and finance in general) is not ditching Excel anytime soon. But for collecting, aggregating, reconciling, cleaning, and standardizing data, Paxata eliminates as much as 80 percent of the manual work that goes into those processes.
I’ve only highlighted a few of the many reasons FP&A departments rely on Paxata to supercharge their output while saving their sanity in the process. (I haven’t even touched on version control or collaboration.)
DataRobot is the leader in Value-Driven AI – a unique and collaborative approach to AI that combines our open AI platform, deep AI expertise and broad use-case implementation to improve how customers run, grow and optimize their business. The DataRobot AI Platform is the only complete AI lifecycle platform that interoperates with your existing investments in data, applications and business processes, and can be deployed on-prem or in any cloud environment. DataRobot and our partners have a decade of world-class AI expertise collaborating with AI teams (data scientists, business and IT), removing common blockers and developing best practices to successfully navigate projects that result in faster time to value, increased revenue and reduced costs. DataRobot customers include 40% of the Fortune 50, 8 of top 10 US banks, 7 of the top 10 pharmaceutical companies, 7 of the top 10 telcos, 5 of top 10 global manufacturers.
-
How to Choose the Right LLM for Your Use Case
April 18, 2024· 7 min read -
Belong @ DataRobot: Celebrating 2024 Women’s History Month with DataRobot AI Legends
March 28, 2024· 6 min read -
Choosing the Right Vector Embedding Model for Your Generative AI Use Case
March 7, 2024· 8 min read
Latest posts
