


Building the AI-Driven Baseball Analytics Team
With the 2020 World Series underway, most MLB teams have shifted to their off-season priorities of building their 2021 squad, as well as making improvements to the way they manage their baseball operations in the front office. Baseball analytics departments are a bigger part of that group now, so I offer this look at getting the most out of that function for organizations that want to realize their full potential and convert data into wins.
Moving AI Into the Big Leagues
No trend has changed the way a sport has been played as dramatically and as enduringly as the analytics revolution in baseball. We are closing out the second decade since the “Moneyball Revolution” introduced baseball analytics into the MLB mainstream and lexicon. What started out as a move of desperation in the bowels of the Oakland Coliseum with Billy Beane and the Oakland A’s of the early 2000s has become a full-fledged paradigm shift in the way baseball is measured, evaluated, coached, and strategized. It has progressed beyond basic sabermetrics and moved into the advanced realms of AI and machine learning, reaching every corner of the sport — from MLB front-offices to little league backfields. MLB machine learning analysts are now thought of as the best ROI investment in an organization’s budget.
However, many organizations have taken radically different approaches to building their analytics capability for reasons ranging from budget to capability to commitment. Some are analyzing baseball data with R and Python to leverage AI and machine learning; some are pushing spreadsheets to their limits with sabermetrics; and others are just beginning their journey to find what works for them. Our DataRobot team has worked with many different organizations, ranging from MLB to NCAA to sports service providers, looking to build their baseball analytics capabilities. Along the way, we’ve learned many best practices and principles for a successful and productive operation.
In this post, I’ll briefly discussed what we’ve learned about why baseball analytics are so important to organizations at any level who are serious about winning, the common failure modes that sink baseball analytics efforts, the organizational building blocks that lay the foundation for a strong baseball analytics capability, and the framework for a baseball analytics use case development cycle to consistently and reliably generate impact from data and insights.
Why Building Your Baseball Analytics Function Matters
In short, making smart, analytically-driven baseball decisions is the cheapest way to create wins. Player performance data is getting cheaper and more informative all the time and reaching every level of the game, while competition and cost for the best players continue to escalate. Thus, the most efficient path to creating wins is extracting usable insights from the data that inform roster management, player development, in-game strategy, and other decisions to drive the best performance from the team that you have.
In the book The MVP Machine by Ben Lindbergh and Travis Sawchek, the authors conduct an extensive study of players and organizations that are turning to analytical means (among others) to squeeze significant improvements in performance from existing rosters, creating more wins and value without spending a single dollar on additional player contracts. There is almost no better example than Trevor Bauer who is profiled extensively in this book. As a pitcher not blessed with the greatest physical abilities, he resorted to smarter means and tactics to derive improvement in his performance, including advanced biomechanical and analytic tools. This should pay off for Bauer in 2020 as one of the top candidates for the Cy Young award — given to each league’s top pitcher.
A few examples of ways that advanced analytics are changing the game and creating value (wins) for teams (ranging from most tactical to most strategic):
- Pitch selection and anticipation: Pitchers and hitters can leverage advanced analytics to determine the optimal pitch sequence for the pitcher to get the hitter out or the pitches the hitter should anticipate.
- Defensive shifts and positioning: Better understanding of pitcher-hitter tendencies and an ability to predict hit locations allows the team in the field to put their players in the optimal positions to create outs and prevent runs.
- Line-up construction: Selecting the players to play and the optimal batting order for maximum offensive and defensive production.
- Injury risk prediction and prevention: Understand the likelihood of player injuries and drivers of injuries to manage team and individual risk.
- Roster construction: Project medium- and long-term production from players to balance player development, current player production, and cost.
- Player development: Identify techniques, tools, methods, and signals that can help with identifying and developing potential in younger players and turn them into performing members of the organization.
Getting your analytics strategy and capability right can unlock tremendous value in each of these areas, which means additional wins in the short-, medium-, and long-terms at a fraction of the cost of developing fully mature talent (e.g., recruiting or free agency costs).
Common Failure Modes in Building Your Analytics Function Correctly
The costs of going about incorporating analytics into your baseball operations the wrong way can be very high. Those range from the wasted cost of analytics software and analysts in the best case scenario to actively hurting on-field performance with bad strategies and poisoning player and coach sentiment towards analytically-driven decisions and ruining the potential for future impact from analytics.
Some of the typical failure modes we see in Analytics pursuits that set teams back:
- Bad or limited data: All analytics efforts must start with a good understanding of data quality and sufficient sample size to draw insights from. Given the high variability in baseball performance, large sample sizes are necessary for most analysis. Often, we see starting datasets that have inconsistent quality; have unknown gaps or holes in the data that aren’t adjusted for; don’t have the ‘width’ necessary, such as the detailed attributes that can come from a Trackman system; or aren’t ‘tall’ enough, meaning samples sizes are too limited to adequately drive modern advanced analytics techniques.
- Bad feature engineering: Getting a good raw dataset is a starting point, but to be able to get meaningful insights from the data, the team must create abstractions from the data that are more meaningful to analytics tools and machine learning models. For example, “curveball” doesn’t mean much to a machine learning model, but “85 mph velocity and 12-inch vertical break” does because these variables can be used in regression analysis. Additionally, relationships between features can be more insightful than the features themselves. Good feature engineering is as essential to analytics and AI as good data.
- Poor problem framing: To get a good answer from analytics, you have to ask it a good question. A simple example in baseball that we see a lot is an overly simplified model to predict the answer to the question, “How many runs will Team A score in a specific game?” Sure, you can build a regression model that will give a point answer, but the variability around that prediction will be a mile wide. There simply are too many component parts of how many runs a team will score over nine innings. Instead, the better question to ask is: “How many runs will be created from a given pitcher-hitter match-up?”. Then that model is used to simulate a nine inning game. This is more work, but it’s a question better suited to machine learning and analytics techniques, which will give you a better answer.
- Lack of explainability: Any three-year-old will teach you that an order or recommendation without justification will also be countered with a “Why?” question. This is true with children, it’s true in business, and it’s true with baseball players. So, when suggesting to a pitcher that they completely change their approach to pitch selection strategy (e.g., throw twice as many curveballs), there must also be trust and a justification showing why that will be more effective and in terms the recipient of that information can understand. The worst thing you can do is hand a player or coach analytically-driven recommendations without justification, but a close second is giving them technical justifications in language that only a data scientist could understand.
Organizational Building Blocks of a Good Analytics Function
The starting point of establishing a strong analytics capability in your baseball team is getting the organizational principles right. That is, getting the people, processes, and practices in place to support high quality and productive analytics insight to become realized impact (wins). Depending on team resources and vision, the exact shape and motion of the analytics function can take many forms. However, there are a few basic principles for the baseball analytics function that we’ve seen lead to success when followed correctly –and failure when disregarded.
- Alignment on Drivers of Value: All members of the organization should have a common focus on where the most value (wins) can be created for the team. This will keep everyone rowing in the same direction. For example, you are bound to fail if your on-field weakness is relief pitching and high-leverage situations, but your analytics team is focused on launch angle for hitters.
- Experts in Data Science and Baseball: Put together a team of equipped and enabled analysts or data scientists who, first and foremost, have baseball expertise to understand the dynamics of the game that lead to success, as well as the analytical skills to use the most modern analytics and AI/ML tools for producing powerful insights. Data scientists are already in low supply, so finding the data scientist with a knack for baseball is even more difficult. However, there are ways to overcome this gap.
- Recurring Cross-Functional Meetings: Encourage organizational practices that bring together the people driving the analytical activities with the on-field leaders who are coaching and managing players. These discussions should have an agenda centered on aligning on goals, tactics, pragmatic approaches, and sharing ideas.
- Pathways for Implementation: The analytics team is meant to be an R&D function, not a science experiment; so there must be standardized routines for turning their insights into on-field improvement. One example where this works well is insights-powered bullpen sessions, where the analytics team provides a development plan for the pitcher to use during a bullpen session, then real-time model insights driven by a tool like Rapsodo for instant feedback.
- Metrics for Measurement: For any driver of value that the organization chooses to focus on, there must be a corresponding metric that the analytics team can be held accountable to fairly. So, if the analytics team is tasked with generating insights to improve bullpen performance in high leverage situations, you’ll want to set a goal for improvement in xFIP for relief pitchers in these at-bats, then track team performance and hold the analytics team and bullpen coach accountable to that goal.
A Framework for Your Baseball Analytics Use Case Development
Once you have the organizational building blocks in place, you can then move onto implementing the use case development lifecycle that will work best for your team. There is no universally correct answer to this process; factors such as team organizational structure, analytics maturity and fluency, resources, short- and long-term vision, and others will influence the best local implementation. However, we can offer a basic framework to start you in developing your own process. No matter who you are, though, your end goal should be a reliable and repeatable motion to produce analytics models that lead to on-field improvements; no different from helping a pitcher develop reliable, repeatable, and sustainable pitching mechanics.
This framework starts with the end in mind — which is how analytics will ultimately influence on-field decisions and performance — and works backwards to the foundations of data collection and handling.
Use Case Development Framework
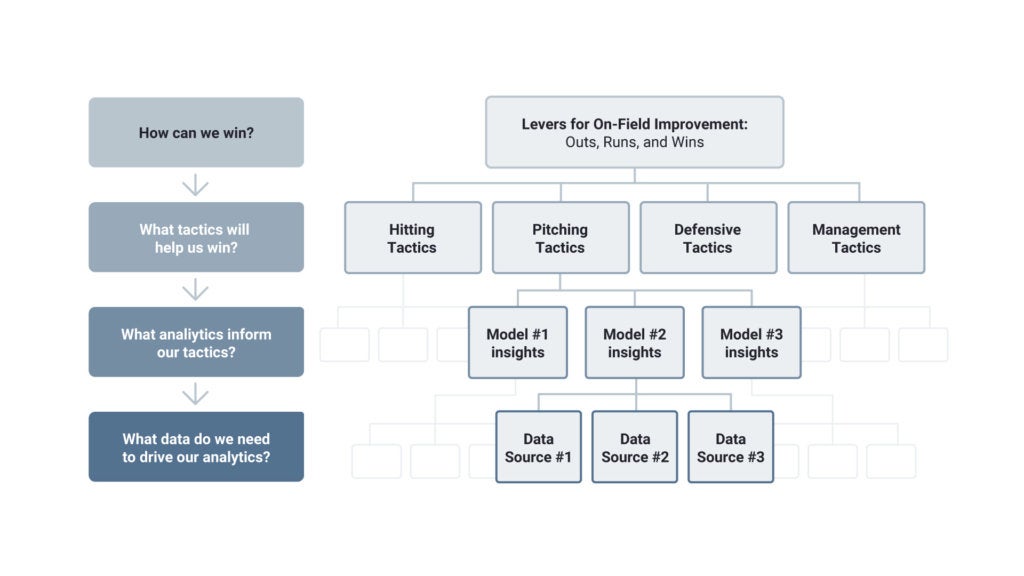
- Define your levers for on-field improvement: Through consultation with your on-field coaching leadership and analytics leadership, discuss and document the organization’s hypotheses for where analytics can create the most on-field impact. These could also be considered your strategic priorities for using analytics to improve organizational performance. Examples include:
- Identify developing players with the most potential for long-term impact
- Improve pitcher performance through better pitch selection
- Improve hitter performance through optimized biomechanics
- Reduce runs allowed with better defensive positioning
- Design the tactics and tools to impact those levers: These would be the specific decisions or actions that can be taken to effect the strategies defined above. This is where discipline, attention to detail, and good logical reasoning are critical for breaking down a qualitative strategy into quantifiable component parts. It also requires a data science perspective to ensure the tactics defined are achievable through machine learning and analytics methods. Following through on one of the strategies above, the tactics for “Improve hitter performance through optimized biomechanics” might include:
- Triage pitches faced by desirability to the hitter, grouped by location and type
- Using images from swing motions, use Visual AI to diagnose biomechanics leading to desired outcomes (e.g., high exit velocity)
- Understand the impact bat design and dimensions can have on exit velocity
- Develop an implementation strategy for each tactic: The best strategy is useless if it can’t effectively be converted into real-world action. This is especially true for analytically-driven strategies since they are created in a world completely separate from front-line operations, so implementation is often a major sticking point. Some of these implementation strategies require heavy emphasis on “translation,” which is effectively communicating data science insights in the language of the player or coach. Alternatively, some tactics have a structural barrier in that it is either impractical or illegal to consult analytic models from the dugout during a game, so the insights of a model must be converted to heuristic tools.
- Referring to another one of the examples above (Improve pitcher performance through better pitch selection), the ideal implementation would be to consult a machine learning model before every pitch that accounts for the pitcher, hitter, game situation, at-bat situation, weather, and so on; but this type of technology in the dugout is illegal in all professional leagues. Thus, the insights from these models could be simplified and converted into situation -> recommendation heuristics that can fit on an index card and kept on a wrist-band worn by the catcher.
- Scope the analytics models and data requirements for those tactics: To build effective models, you must have the right data. This is where consultation with the baseball experience in your organization can go a long way. Bringing the data scientists together with the on-field coaches can create fantastic ideas about the data that can be most helpful. For example, it might only become apparent to a data scientist that the effectiveness of a change-up changes dramatically depending on the location of the pitch; or that a hitter’s achieved exit velocity can be impacted by the motion of their hips. There are several ways to share this knowledge and build the right datasets, but common methods include:
- Cross-function data brainstorming: With a single tactic in mind (e.g., Visual AI to diagnose swing mechanics), share the knowledge from the on-field coaching staff about what might lead to better performance and ideate about other potential data sources (e.g., bat grip, Trackman pitch data, ball-contact point on the bat). The goal would be for the data scientists to develop a comprehensive wish list of data they’d need to develop the best models possible.
- Data gap analysis: Using that wish list, assess what data you already have in your organization (with sufficient quality and quantity) and where you might have gaps. For the gaps, attempt to triage them as critical, important but sub-critical, or nice-to-have.
- Assess options for gaps: Determine the most effective means to close the most critical gaps. For example, if trying to improve hitter swing mechanics, something like a Rapsodo imaging unit can quickly collect high quality visual and launch data that can drive biomechanical models. Acquiring one of these units would also require a standard operating procedure for use and data collection to ensure the on-field group gets data in the right quality and quantity.
- Design the data collection system to drive those models: The landscape of data collection tools and practices is wide and diverse in the baseball world. Some data, such as scouting reports, are collected manually by a diverse set of personalities, while others, such as Trackman pitch data, are collected in extremely automated and consistent ways. Marrying all of this data into a dynamic, reliable, and informative data architecture is critical for a foundation to feed a wide library of use cases, but adding specific data needs, features, abstractions, and aggregations that will help the use case in focus and future use cases is an important step to do correctly.
- Define your levels of aggregation: Are you looking at pitches, at-bats, innings, or games? This is a simple decision with a huge impact on data collection and engineering.
- Join your categoricals to quantifiables: Many analytics tools will learn faster and perform better when dealing with quantifiable variables instead of categoricals. A model wouldn’t have any idea if “Max Muncy” and “Kyle Schwarber” are similar players, but it would be able to see similarities between “left-handed, six-foot tall, ~220 pounds, 0.870 – 0.890 OPS, with 35 – 38 homeruns” hitters.
- Create checks for data quality: Data will come from a wide array of sources, with varying standards for data quality and consistency. Thus, it’s important to identify the data that is most important to your use case and build-in quality checks and preparation steps to feed the analytics.
Additional Best Practices for Enabling your Analytics Function
If you’ve adopted these organizational best practices and built an effective use case delivery lifecycle, then you’re well on your way to a healthy and valuable analytics function. However, there are a few more tips and best practices we’d like to share:
- Build a model factory: The volume of analytics models you’ll need to develop will far outstrip anything your team of analysts and data scientists can produce by hand, so start with an automation-first mindset for testing and scaling hypotheses and turning them into sustainable tools.
- Employ agile methodologies for model development: Be disciplined in recognizing when to kill projects because they won’t deliver the value necessary to justify investment, and always listen to your customer (e.g., players or coaches) to ensure the tool you are building is the tool they want — not the one you want to make.
- Over-invest in analytics translation: The best pitch sequencing model in the world is worthless if it can’t be adequately translated into terms and justifications that the coach and player can understand. Oftentimes, the supporting reasoning behind AI/ML-driven recommendations are complex and nuanced, so a person who can understand both the data scientist and the pitching coach is highly valuable by bridging the gap between how these two important members of your organization think.
- Separate church (scouting) and state (analytics): Analytics is a supplement to scouting, not a replacement. However, these two functions should operate as independently as possible so as to not let the beliefs, biases, and philosophies of one influence the other. If they agree on recommendations for the future, then you’re in great shape. If they disagree, then you get to enjoy a highly productive conversation that will make your entire organization better.
- Focus on your younger players: The greatest gains to be had (and highest ROI) will come from using analytics to make your everyday non-elite players capture marginal gains. You’ll enjoy far greater gains by learning how to make a 1-WAR players play like a 2-WAR player than making a 6-WAR player play like a 9-WAR player because those 1-WAR players are exponentially more affordable and fungible.
The AI-Driven Walk-Off
Baseball analytics offers tremendous value but must be done correctly to get the most from the organizational investment and change, harness the potential of AI and analytics, and to stay competitive on the playing field. First, baseball teams must put the right organizational building blocks in place: alignment on goals, data science and baseball expertise, development and implementation processes, and metrics for impact. Teams must also have an effective use case development cycle that sets clear visions connected to winning, on-field tactics to realize those visions, analytics models to support tactics, and good data practices for driving those models. By tackling these basics, an effective analytics function can start creating wins for the team they support and driving better organization performance.

He has led or advised CEOs in digital transformations across several industries and geographies. He lives in Dallas, TX with his wife and dog. Prior to joining DataRobot, he was Head of Digital and Transformation at TSS, LLC and a consultant at McKinsey & Co.
-
How to Choose the Right LLM for Your Use Case
April 18, 2024· 7 min read -
Belong @ DataRobot: Celebrating 2024 Women’s History Month with DataRobot AI Legends
March 28, 2024· 6 min read -
Choosing the Right Vector Embedding Model for Your Generative AI Use Case
March 7, 2024· 8 min read
Latest posts
