


Building a March Mania Bracket Using Machine Learning
Editor’s Note – This post was updated March 29th to check in on the results of our model, and share our predictions on the final four.
Editor’s Note – This post was updated March 22nd to check in on the results of our model.
It’s that time of year again. Since I was a kid, I’ve always been swept away by March Mania. I’m not much of a college basketball fan, but I remember printing out brackets with my dad and brothers, filling them in with our best picks and watching the games together with my family.
It was a great way to bond, and it’s part of what makes March Mania so special. You might not know your Tigers from your Wildcats or your Racers from your Volunteers, but there’s a special camaraderie that comes from completing brackets with family, friends, and colleagues.
There’s only one problem: knowing who to pick. Very few of us watch many (if any) games during the season, and there are so many aspects of gameplay to consider. It can be tough to lose to someone who picked their winners purely based on team mascots or their favorite vacation destinations. And while it’s difficult to win against people who follow every bounce of the ball, AI and machine learning can help you make picks as informed as a casual basketball fan.*
That just may be enough of an advantage to win your bracket pool. To be clear, this isn’t a strategy to make you rich by betting all your money—let Mattress Mack serve as a cautionary tale for that—but it’s a fun way to be competitive with your friends and family who spend the entire season watching college basketball and know every team.
For the past decade, I’ve used the data of past tournaments to build a machine learning model for completing March Mania brackets. These models seem to be about as well-informed as a casual basketball game, and it’s helped me compete more closely with my family members who pay a lot more attention to basketball than I do.
Here’s what’s most helpful to look at.
Building the March Mania Model
Using a logistic regression model, I’ve developed a way to predict games throughout the tournament. Of course, it’s still not possible to be correct with 100% of your picks, but this can help provide some clarity if you’re stuck on who to select when making your picks.
With 64 teams in the tournament—for our purposes, we’re discounting the First Four games on Tuesday and Wednesday—there are 4,096 potential matchups. That’s a lot of variance, so it’s best to keep it simple.
The model runs a Monte Carlo simulation of 10,000 games and consists of two main elements:
- Power ratings: These ratings are something I’ve worked to hone over the years for both the men’s and women’s tournaments. They look at data from the regular season and are based on Ken Pomeroy’s methodology.
- Point spread: For the men’s Tournament, the Las Vegas odds for the initial games are a great source of data for the first round of the bracket. If a team is favored to win by 25 points, they’re very likely—though not certain—to win. If a team is only favored to win by one or two points, the game will likely be close.
Running this model, here’s a look at my predicted bracket for the Men’s Tournament:
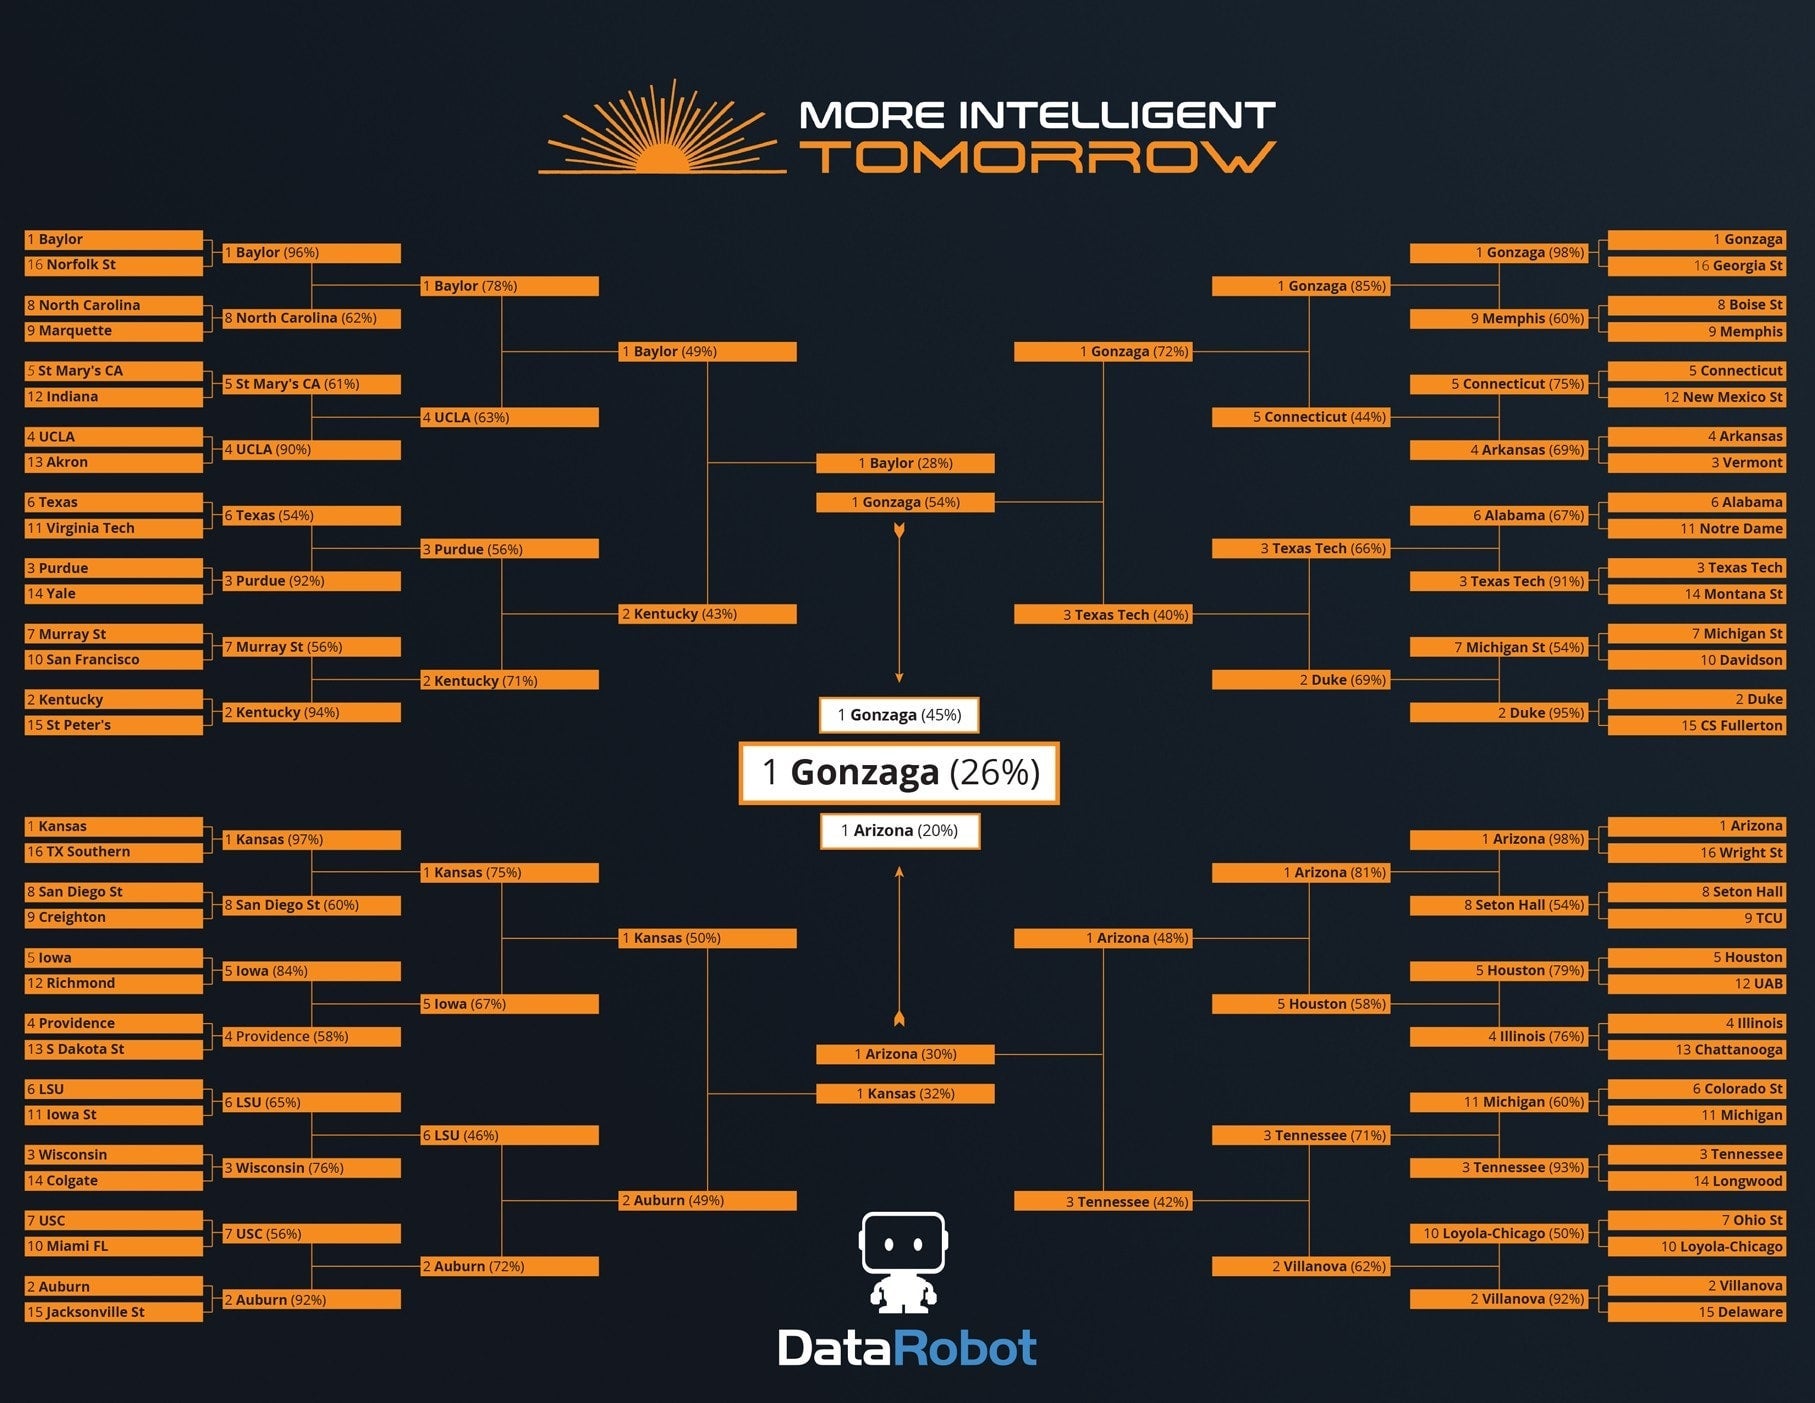
Here are my top 10 favorites to win this year’s Men’s Tournament, and their probability of winning.
- Gozanga – 26%
- Arizona – 10%
- Kansas – 7%
- Baylor – 7%
- Houston – 7%
- Kentucky – 6%
- Tennessee – 5%
- Auburn – 4%
- Texas Tech – 4%
- Villanova – 4%
If you’re looking for some potential upsets in round one, here are the most likely surprises for the men’s bracket:
- Michigan (11) over Colorado State (6) – 59% chance of upset
- Memphis (9) over Boise State (8) – 59% chance of upset
Here is my predicted bracket for the Women’s Tournament:
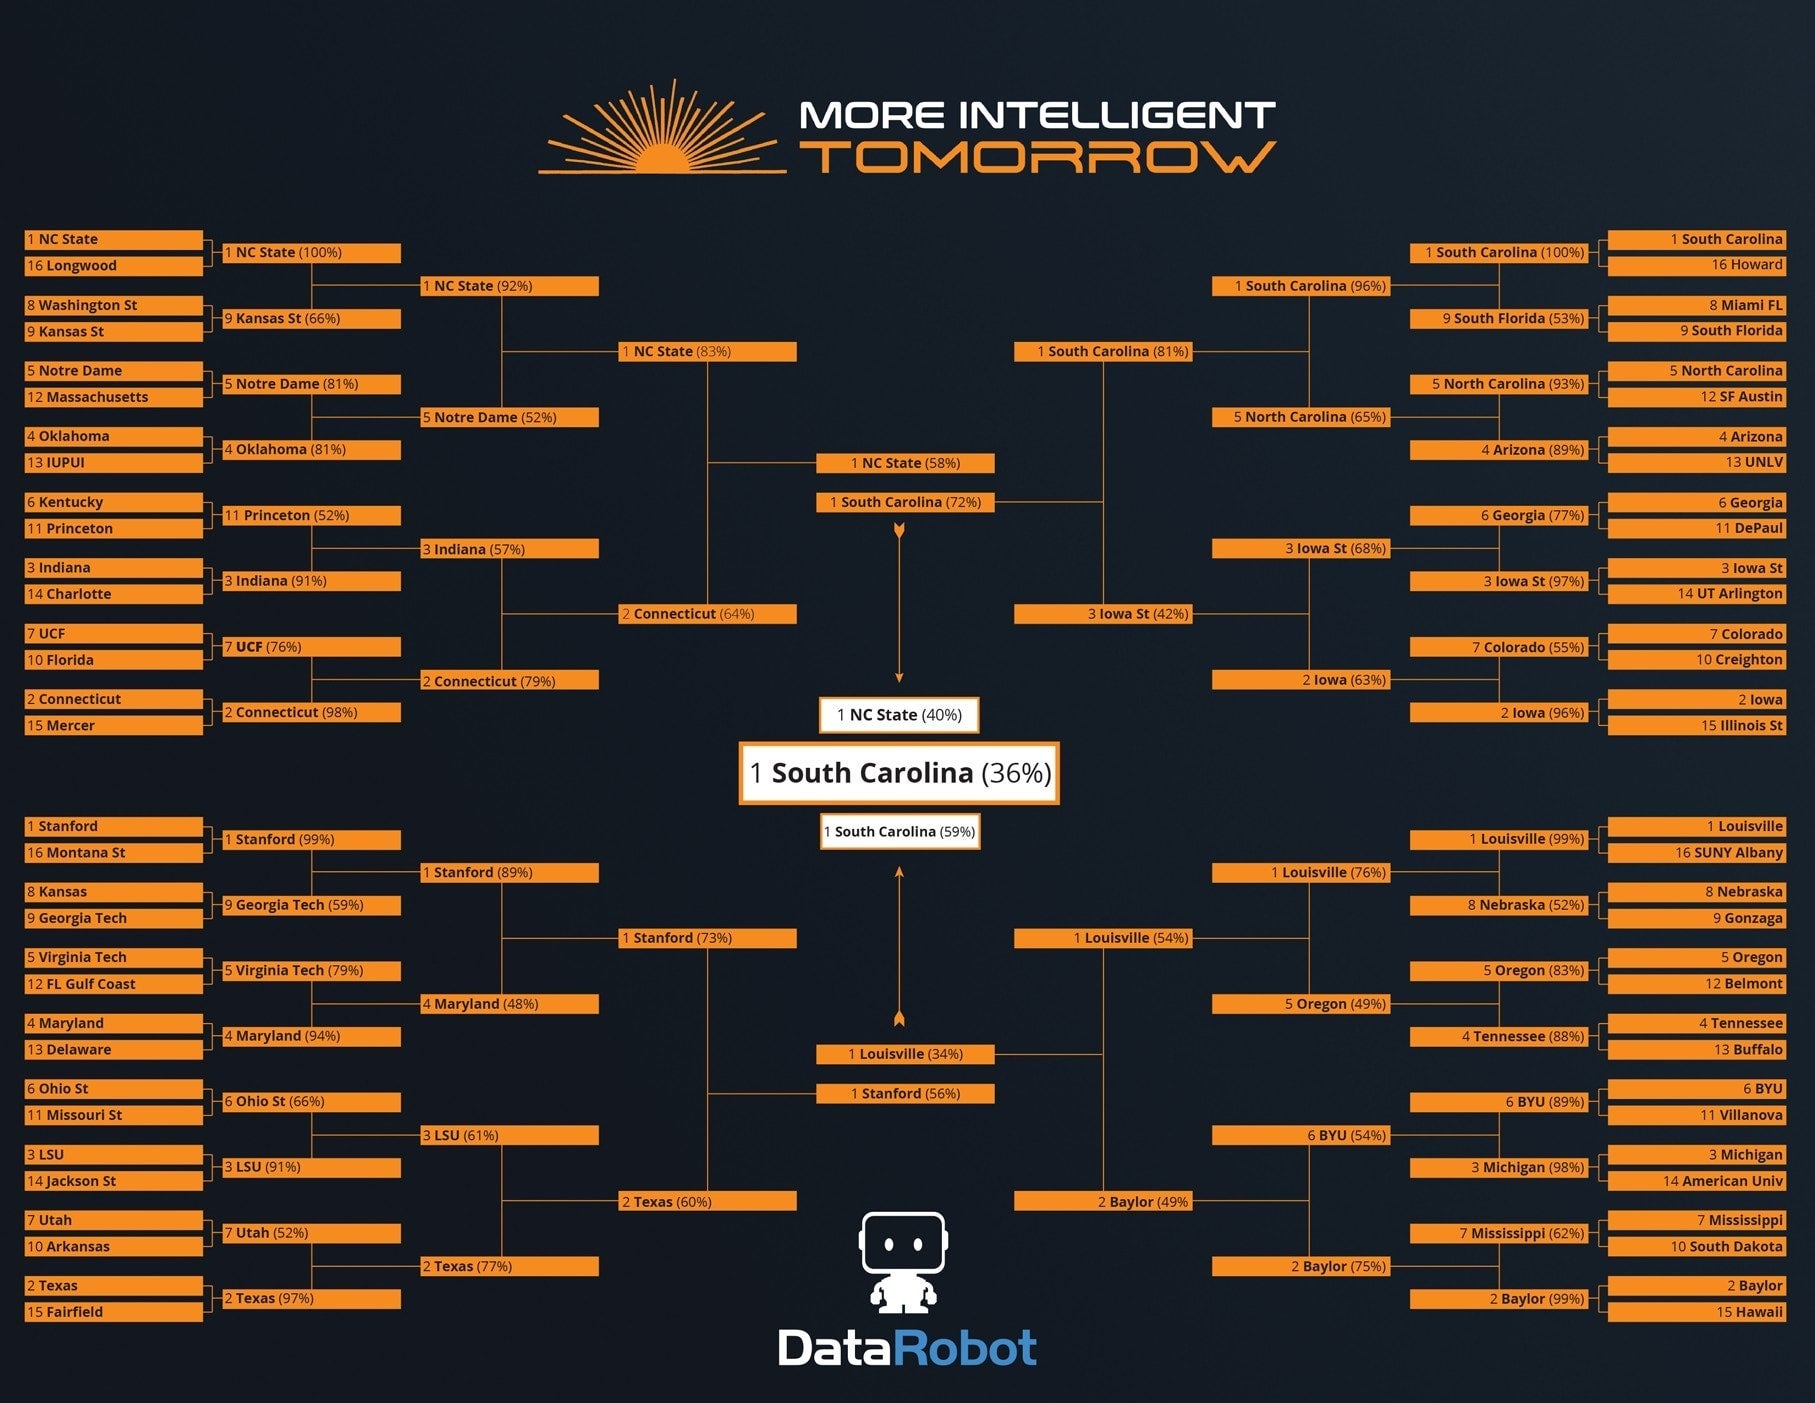
Here are my top 10 favorites to win this year’s Women’s Tournament, and their probability of winning:
- South Carolina – 36%
- NC State – 19%
- Stanford – 16%
- Connecticut – 7%
- Louisville – 5%
- Texas – 3%
- Baylor – 3%
- North Carolina – 2%
- Iowa State – 1 %
- BYU – 1%
If you’re looking for some potential upsets in round one, here are the most likely surprises for the women’s bracket:
- Princeton (11) over Kentucky (6) – 51% chance of upset
- South Florida (9) over Miami (8) – 53% chance of upset
- Georgia Tech (9) over Kansas (8) – 59% chance of upset
- Kansas State (9) over Washington State (8) – 66% chance of upset
Other models look at some of the more traditional basketball metrics. While they may provide a bit of value, they also offer some challenges:
- If you go by seeding alone, you won’t pick any upsets correctly. For example, 37.5% of 11 seed teams beat 6 seeds since 1985. Sometimes, the matchup is such that the worst seed—which would be viewed as inferior by a seeding-centric model—is actually the favorite to win the game.
- You could also look at the win-loss record of each participant. A team like, say, Gonzaga or Auburn looks really good, sporting a high winning percentage. However, both of those teams lost in the final two weeks of the regular season, so you could argue they’re not playing at their best. Similarly, other teams with shaky records may suddenly be playing very well, but it wouldn’t look that way based on record alone.
- Wins and losses also don’t account for margin of victory—a one-point victory is typically a coin flip. A team that won a lot of games by a single basket may not be nearly as strong as their record suggests.
- Other elements like the final AP or Coaches Poll rankings provide a nice overview of where teams currently are in the standings, but that’s based on their recent play, which is primarily against teams in their own conferences. Those intra-conference matchups rarely happen until later rounds, and they never occur in the first round, so poll rankings don’t provide a full picture.
Putting the Data to Work
The current format of the Tournament, with a 64-team bracket, began in 1985. Current box score data goes back to the mid-80s, and point spread data reaches back to 2003. As we play more tournaments, we’ll continue to get more data.
However, simple models seriously outperform complex models. More stats usually don’t lead to better results—in fact, it’s quite often the opposite. I’ve tried hundreds of different, crazy stats over the years, and they almost always impede the model. Selecting one or two highly informative variables is consistently a better move than trying to load up models with too much data. This is a really, really hard dataset to model—there’s a LOT of noise and very little signal. Keeping your model simple helps cut through the noise, but you will never be able to predict basketball game outcomes with a high degree of certainty.
For me, I’ve found betting spreads and power ratings provide the best results. If you’ve developed a model, you might look at the distance each team must travel to play their tournament games, or the number of senior guards a team has on the roster. But keep it simple—limit yourself to one or two highly informative variables.
This is also a good reminder that in statistics, “very rare” is not the same thing as “impossible.” For years, bracket experts have touted picking a number 1 seed to win its first-round game. Since the tournament field expanded to 64 teams in 1985, every No. 1 seed has beaten every No. 16 seed for 33 straight years.
When No. 16 seed UMBC knocked off No. 1 Virginia—a team that had only lost two other games all year—in 2018, it shocked a lot of college basketball fans. They thought such an upset couldn’t happen. But, looking at the model, Virginia had a 95% chance to win that game. In other words, UMBC had a 5% chance, or would record one win in every 20 games against Virginia. Their victory was certainly a long shot, but it wasn’t impossible. In fact, you should expect a 1 vs 16 upset to occur roughly every 5-10 years in the tournament, although it’s impossible to predict which year exactly will feature such a huge upset.
One other wrinkle from incorporating too much data—every time you add a dataset, you have to account for how all that data is entered and labeled. Let’s take the Saint Mary’s Gaels, for example. One dataset lists them as Saint Mary’s. Another may write St. Mary’s. A third may do SMC for Saint Mary’s College, while yet another does St Marys.
On top of that, you have to make sure you’re actually getting data from the St. Mary’s College of California in Moraga, not one of the other 14 St. Mary’s colleges and universities across North America.
So, again, I suggest you keep any machine learning model simple. Basketball is a noisy game, and simpler models deal well with noise. My dad likes to say, “they’re just kids!” You were likely more unpredictable when you were 18 to 21 years old, and March Mania is similarly full of crazy, wild moments. Yet, that’s part of what makes the games so fun to watch.
If you develop your own model to try and solve the Mania, don’t overcomplicate things. Pick one or two datasets to work with and see how that goes. You can always iterate down the road.
Best of luck as you fill out this year’s bracket. Now, let the games begin.
March 22nd Update:
We’re back and checking in on the performance of our model throughout the tournament. Let’s dive into the men’s tournament:
Overall Model Performance:
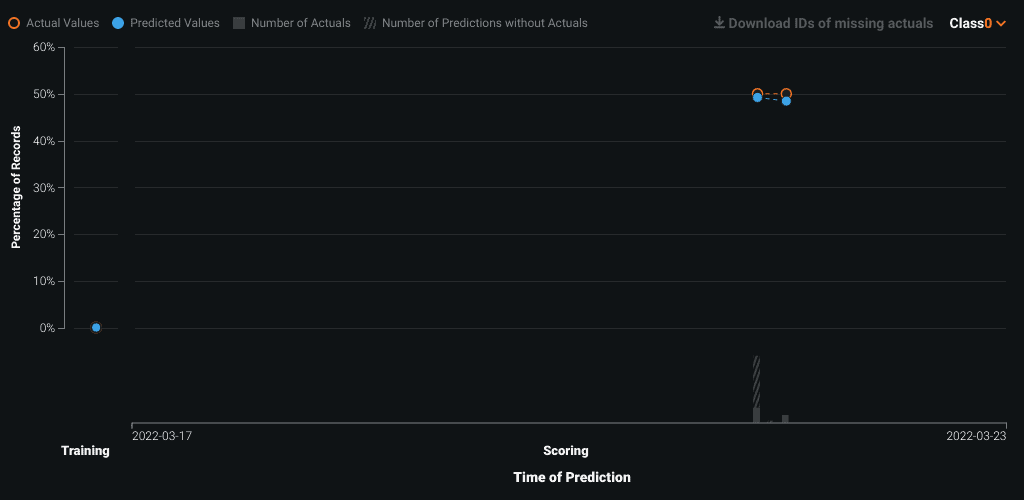
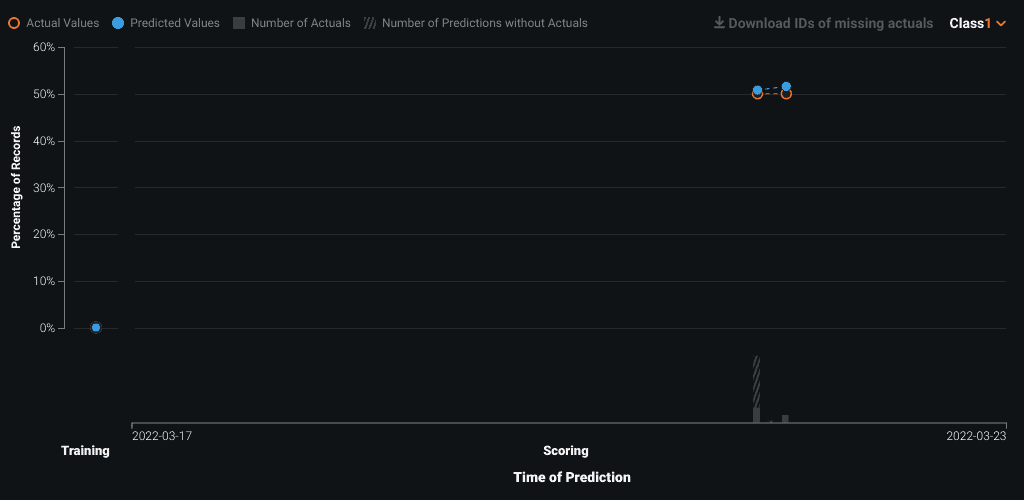
Loading the actual results of rounds 1 and 2, we can see how the predictions vs. actuals performs for both positive and negative class.
1. The predictions vs. actuals performed well for both positive and negative class
Class 0:
Class 1:
Actual Round Results vs Predictions:
I loaded the pairs for each round using a batch prediction job.
My tournament data is stored in snowflake so in this case, I used a prediction job to write the results to Snowflake so I can have all the data in one place.
This is how we can get the predictions for every round and compare them later with the actuals.
The beauty of march mania is the big surprises, everyone can win when you play one game.
Below are the results of the model’s predictions vs the actuals:
Round 1:
Successfully predicted 25 games over 32 total
| Team 1 | Team 2 | Team 1 Win Probability | Team 2 Win Probability | Team 1 Win | Predict Correctly? |
| Akron | UCLA | 9% | 91% | 0 | TRUE |
| Yale | Purdue | 10% | 90% | 0 | TRUE |
| Wright St | Arizona | 4% | 96% | 0 | TRUE |
| Wisconsin | Colgate | 81% | 19% | 1 | TRUE |
| Virginia Tech | Texas | 40% | 60% | 0 | TRUE |
| Villanova | Delaware | 90% | 10% | 1 | TRUE |
| Vermont | Arkansas | 24% | 76% | 0 | TRUE |
| UAB | Houston | 17% | 83% | 0 | TRUE |
| Texas Tech | Montana St | 94% | 6% | 1 | TRUE |
| Tennessee | Longwood | 96% | 4% | 1 | TRUE |
| TX Southern | Kansas | 4% | 96% | 0 | TRUE |
| St Mary’s CA | Indiana | 51% | 49% | 1 | TRUE |
| San Francisco | Murray St | 46% | 54% | 0 | TRUE |
| S Dakota St | Providence | 39% | 61% | 0 | TRUE |
| Ohio St | Loyola-Chicago | 52% | 48% | 1 | TRUE |
| North Carolina | Marquette | 51% | 49% | 1 | TRUE |
| Norfolk St | Baylor | 3% | 97% | 0 | TRUE |
| Michigan St | Davidson | 51% | 49% | 1 | TRUE |
| Michigan | Colorado St | 51% | 49% | 1 | TRUE |
| Memphis | Boise St | 64% | 36% | 1 | TRUE |
| Jacksonville St | Auburn | 5% | 95% | 0 | TRUE |
| Illinois | Chattanooga | 77% | 23% | 1 | TRUE |
| Gonzaga | Georgia St | 96% | 4% | 1 | TRUE |
| Duke | CS Fullerton | 95% | 5% | 1 | TRUE |
| USC | Miami FL | 51% | 49% | 0 | FALSE |
| TCU | Seton Hall | 49% | 51% | 1 | FALSE |
| St Peter’s | Kentucky | 6% | 94% | 1 | FALSE |
| San Diego St | Creighton | 63% | 37% | 0 | FALSE |
| Richmond | Iowa | 16% | 84% | 1 | FALSE |
| Notre Dame | Alabama | 29% | 71% | 1 | FALSE |
| New Mexico St | Connecticut | 22% | 78% | 1 | FALSE |
| LSU | Iowa St | 67% | 33% | 0 | FALSE |
The Surprises
St Peter’s beats Kentucky
No. 15 seed beat No. 2 seed. Not many predicted it. Over 12% of brackets had Kentucky playing in the national championship game, and over 6% had them winning it all.
Richmond beats Iowa
Another big surprise here, No. 12 seed beat a No. 5 seed.
Notre Dame beats Alabama
Notre Dame keeps their momentum.
New Mexico State beats Connecticut
No. 12 seed beat a No. 5 seed. The first 12-over-5 upset in the modern era actually came in the first year of the 64-team tournament, in 1985.
Close Predictions
Miami FL beats USC
USC – Miami – very close game! These two teams are very similar. Miami won only by 2 points.
TCU beats Seton Hall
Again we see a very close prediction (No. 8 seed vs. 9 seed) TCU was underrated as number 9 and still won.
Creighton beats San Diego State
Final score 72-69; only 3 points difference. Creighton had an amazing comeback to win this game.
Iowa State beats LSU
LSU’s coach was fired one week prior to the tournament, which may have contributed to this loss.
Round 2:
Successfully predicted 11 games over 16 total
| Team 1 | Team 2 | Team 1 Win Probability | Team 2 Win Probability | Team 1 Win? | Predict Correctly? |
| Purdue | Texas | 45% | 55% | 1 | FALSE |
| St Peter’s | Murray St | 21% | 79% | 1 | FALSE |
| North Carolina | Baylor | 15% | 85% | 1 | FALSE |
| Tennessee | Michigan | 82% | 17% | 0 | FALSE |
| TCU | Arizona | 20% | 80% | 0 | TRUE |
| Miami FL | Auburn | 14% | 86% | 1 | FALSE |
| Creighton | Kansas | 14% | 86% | 0 | TRUE |
| Arkansas | New Mexico St | 80% | 20% | 1 | TRUE |
| Gonzaga | Memphis | 84% | 16% | 1 | TRUE |
| Duke | Michigan St | 74% | 26% | 1 | TRUE |
| Notre Dame | Texas Tech | 16% | 84% | 0 | TRUE |
| UCLA | St Mary’s CA | 70% | 30% | 1 | TRUE |
| Villanova | Ohio St | 68% | 32% | 1 | TRUE |
| Illinois | Houston | 19% | 81% | 0 | TRUE |
| Iowa St | Wisconsin | 52% | 28% | 1 | TRUE |
| Richmond | Providence | 43% | 57% | 0 | TRUE |
The Surprises
St Peter’s beats Murray State
St Peter’s continues to surprise!
North Carolina beats Baylor
A surprise, as Baylor is the defending national champion.
Miami FL beats Auburn
Another surprise from Miami, No. 10 seed beating a No. 2 seed.
Michigan beats Tennessee
A No. 11 seed beat a No. 3 seed. Michigan played well on defense.
Round 3 Predictions
Here’s our predictions for the next round:
| Team 1 | Team 2 | Team 1 Win Probability | Team 2 Win Probability |
| Providence | Kansas | 15% | 85% |
| Arkansas | Gonzaga | 20% | 80% |
| Texas Tech | Duke | 59% | 41% |
| St Peter’s | Purdue | 13% | 87% |
| North Carolina | UCLA | 20% | 80% |
| Michigan | Villanova | 28% | 72% |
| Houston | Arizona | 65% | 35% |
| Iowa St | Miami FL | 59% | 41% |
Let’s see how well we do for this round!
March 29th Update:
It’s me again! And I’m about to give you an update on the coming final four and the overall winner.
But before that let’s take a look at the predictions and actuals in rounds 3 and 4, how we did and what we can learn from it (men’s tournament):
Round 3:
This round was one of the most surprising rounds in the history of the tournament
This is the mania of march – unlikely events can happen!
| Team 1 | Team 2 | Team 1 Win Probability | Team 2 Win Probability | Team 1 Win? | Predict Correctly? |
| Providence | Kansas | 15% | 85% | 0 | TRUE |
| Arkansas | Gonzaga | 20% | 80% | 1 | FALSE |
| Texas Tech | Duke | 59% | 41% | 0 | FALSE |
| St Peter’s | Purdue | 13% | 87% | 1 | TRUE |
| North Carolina | UCLA | 20% | 80% | 1 | FALSE |
| Michigan | Villanova | 28% | 72% | 0 | TRUE |
| Houston | Arizona | 65% | 35% | 1 | TRUE |
| Iowa St | Miami FL | 59% | 41% | 0 | FALSE |
With all the surprises above, there are some changes we needed to make to the point spreads and the simulation.
Round 4:
| Team 1 | Team 2 | Team 1 Win Probability | Team 2 Win Probability | Team 1 Win? | Predict Correctly? |
| Houston | Villanova | 70% | 30% | 0 | FALSE |
| North Carolina | St. Peter’s | 74% | 26% | 1 | TRUE |
| Kansas | Miami FL | 59% | 41% | 1 | TRUE |
| Arkansas | Duke | 13% | 87% | 0 | TRUE |
Things are back on track! Successfully predicted 3 of 4 games.
Final Four
So what are we expecting in the final four?
Mens Tournament:
| Team 1 | Team 2 | Team 1 Win Probability | Team 2 Win Probability |
| Duke | North Carolina | 72% | 18% |
| Kansas | Villanova | 67% | 33% |
Kansas has a more challenging game than Duke as it’s a seed 1 vs 2, compared to 2 vs 8.
Women’s Tournament:
| Team 1 | Team 2 | Team 1 Win Probability | Team 2 Win Probability |
| South Carolina | Louisville | 71% | 19% |
| Stanford | Connecticut | 65% | 35% |
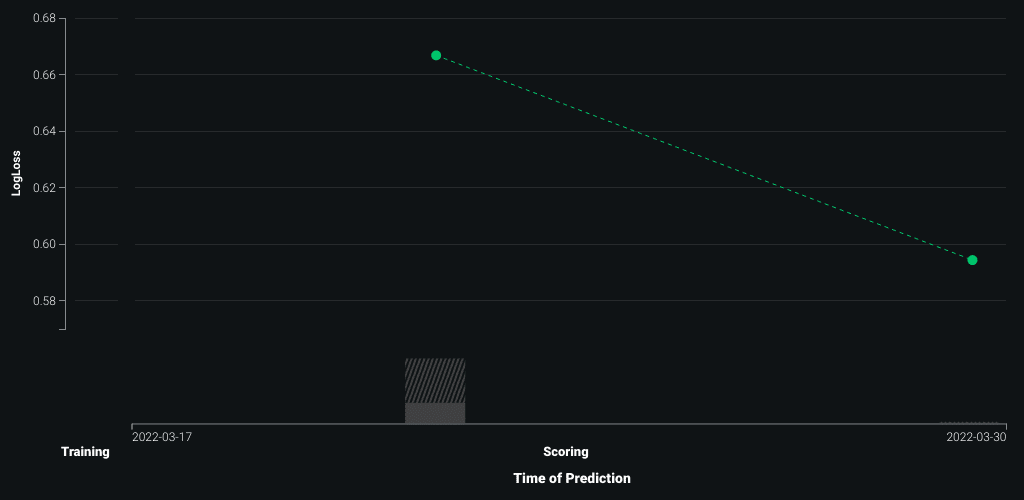
With MLOps, we are still controlling our model in production, and our graphs are keeping updating for accuracy – logloss is getting better.
So far so good! Overall in 108 games, we predicted 70% of the games correctly, which is better than random1.
| Number of games | % | Predicted correctly? |
| 76 | 70.37% | TRUE |
| 32 | 29.62% | FALSE |
After we updated our simulation here are the updated winners:
Men:
Kansas – 42%
Duke – 36%
Villanova – 18%
North Carolina – 3%
Women: (based on Nate Silver’s simulation)
South Carolina – 54%
Stanford – 21%
UConn – 15%
Louisville – 10%
*DataRobot gives no warranty as to the accuracy, correctness, or completeness in live operation of any Model used by the Solution or predictions made by the Solution. The accuracy of the Models and any generated outcomes created by the Solution is dependent on the data used.
*The National Council on Problem Gambling operates the National Problem Gambling Helpline Network (1-800-522-4700). The network is a single national access point to local resources for those seeking help for a gambling problem. The network consists of 28 call centers which provide resources and referrals for all 50 states, Canada and the US Virgin Islands. Help is available 24/7 and is 100% confidential.

Atalia Horenshtien is a Global Technical Product Advocacy Lead at DataRobot. She plays a vital role as the lead developer of the DataRobot technical market story and works closely with product, marketing, and sales. As a former Customer Facing Data Scientist at DataRobot, Atalia worked with customers in different industries as a trusted advisor on AI, solved complex data science problems, and helped them unlock business value across the organization.
Whether speaking to customers and partners or presenting at industry events, she helps with advocating the DataRobot story and how to adopt AI/ML across the organization using the DataRobot platform. Some of her speaking sessions on different topics like MLOps, Time Series Forecasting, Sports projects, and use cases from various verticals in industry events like AI Summit NY, AI Summit Silicon Valley, Marketing AI Conference (MAICON), and partners events such as Snowflake Summit, Google Next, masterclasses, joint webinars and more.
Atalia holds a Bachelor of Science in industrial engineering and management and two Masters—MBA and Business Analytics.

Zach runs the Core Modeling Team that’s responsible for all of DataRobot’s algorithms and meta-algorithms. He studied Ecology at Dartmouth College and has been doing data science for over a decade. Zach is passionate about his 10-month-old daughter, data-driven decision making, and automating boring tasks that no one wants to do.
-
How to Choose the Right LLM for Your Use Case
April 18, 2024· 7 min read -
Belong @ DataRobot: Celebrating 2024 Women’s History Month with DataRobot AI Legends
March 28, 2024· 6 min read -
Choosing the Right Vector Embedding Model for Your Generative AI Use Case
March 7, 2024· 8 min read
Latest posts
