

An Overview of the Deployments Page in DataRobot
This post was originally part of the DataRobot Community. Visit now to browse discussions and ask questions about DataRobot, AI Platform, data science, and more.
When you click on a deployment from the Deployments page, the displayed Overview page provides a model-specific summary that describes the deployment, including the information you supplied when creating the deployment, and any model replacement activity.
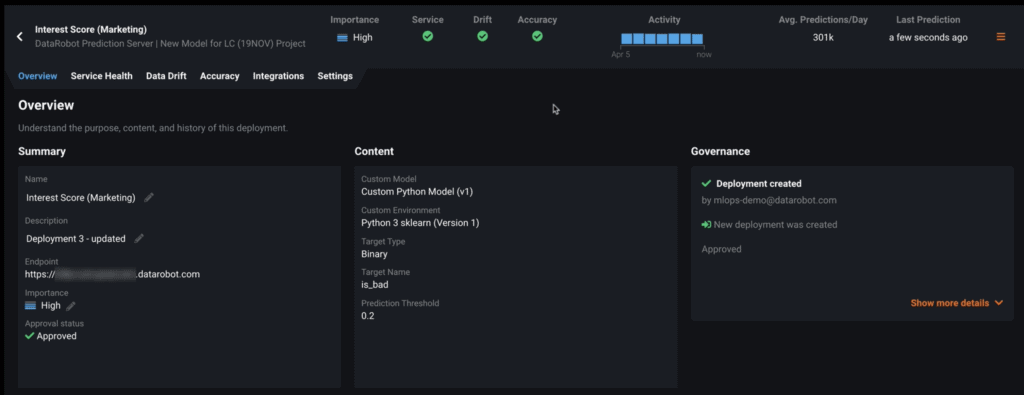
- Summary lists the user-supplied name and description entered when the deployment was added.
- Content provides deployment-specific details, including the target specified, and model information that varies depending on the type of deployment it is such as the dataset used to create the model if available or information about a custom model.
- History information reports the create and deploy dates, along with a log of when a model is replaced.
- And Governance provides organizations a way to implement an approval process for model management.
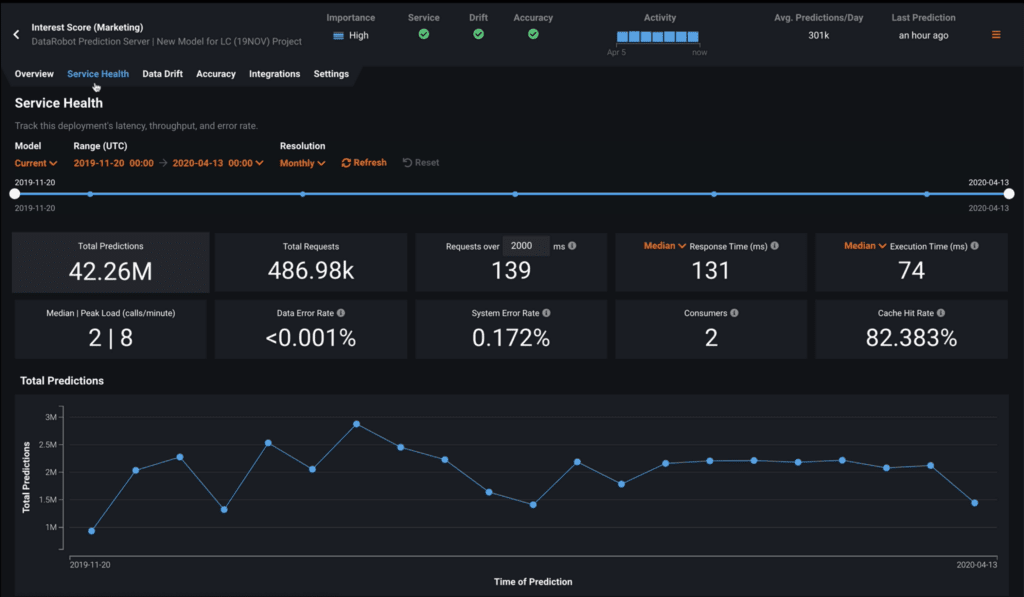
The Service Health tab tracks metrics about a deployment’s ability to respond to prediction requests quickly and reliably. This helps identify any bottlenecks affecting speed and response time. It also helps you assess throughput and capacity, which is critical to proper resource provisioning in order to support good performance and latency levels.
- The data range slider allows you to select the range of time from which to generate activity data.
- Each of the metric tiles (below the data range slider) describe a performance activity level measurement and its health for the deployment.
- The Service Health chart (below the metric tiles) displays individual metrics over time, helping to identify patterns in quality of service.
Clicking on a metric tile updates the service health chart to represent that information. You can adjust the date range slider to narrow in on a specific period of time, and you can also adjust the time period resolution from monthly down to hourly if available.
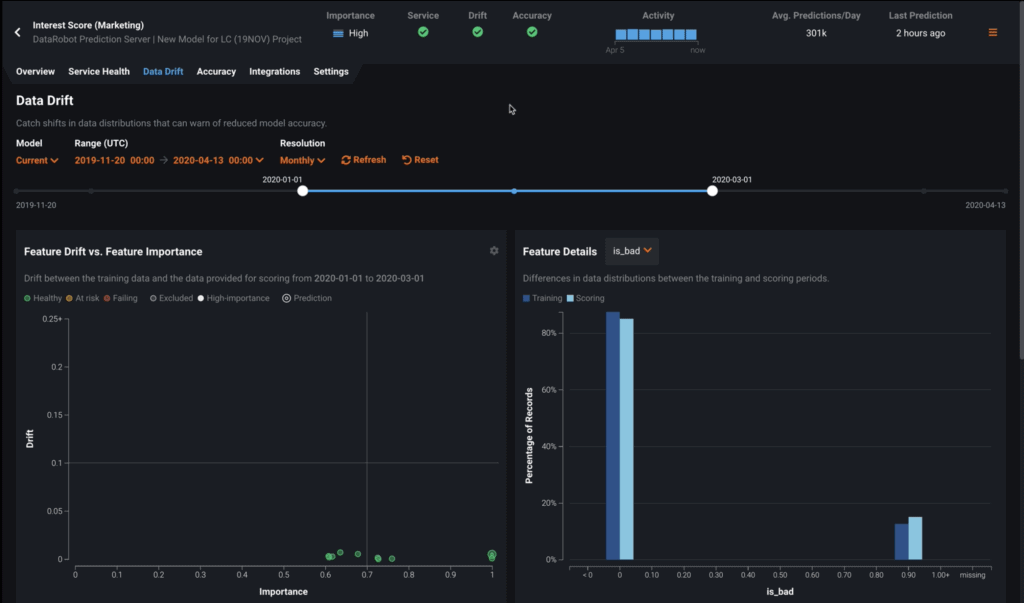
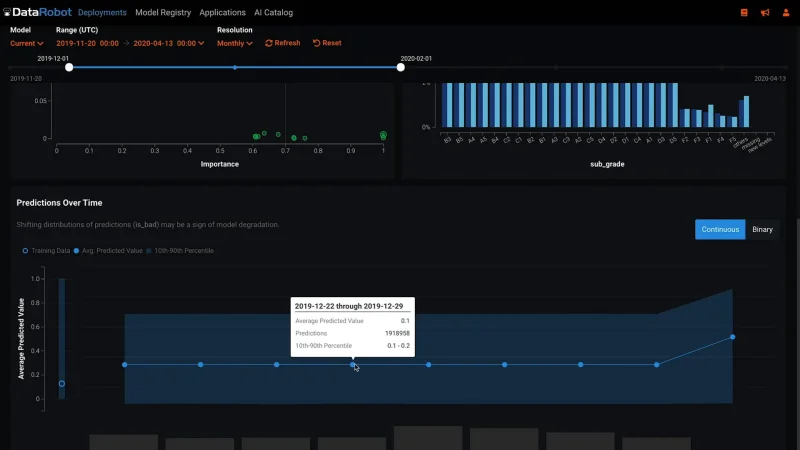
Next is the Data Drift page. By leveraging training data (aka “learning data”) and prediction scoring data (aka “inference data”) that are added to your deployment, the Data Drift dashboard helps you to analyze a model’s performance after it has been deployed. It provides three interactive visualizations that identify the health of a deployed model over a specified time interval. The date range slider in the first section works the same as it does on the Service Health page.
- The Feature Drift vs. Feature Importance chart plots the importance of a feature in a model against how much the distribution of actual feature values has changed, or drifted, between one point in time and another.
- The Feature Details chart plots the percentage, or distribution, of records of the selected feature in the learning data compared to the inference data.
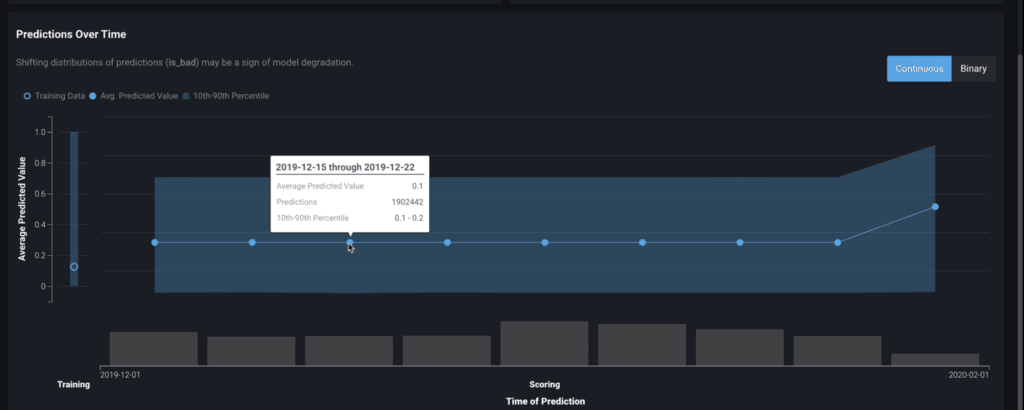
The Predictions Over Time chart illustrates how the distribution of a model’s predictions have changed over time. The display differs depending on whether the data is from a regression or binary classification model.
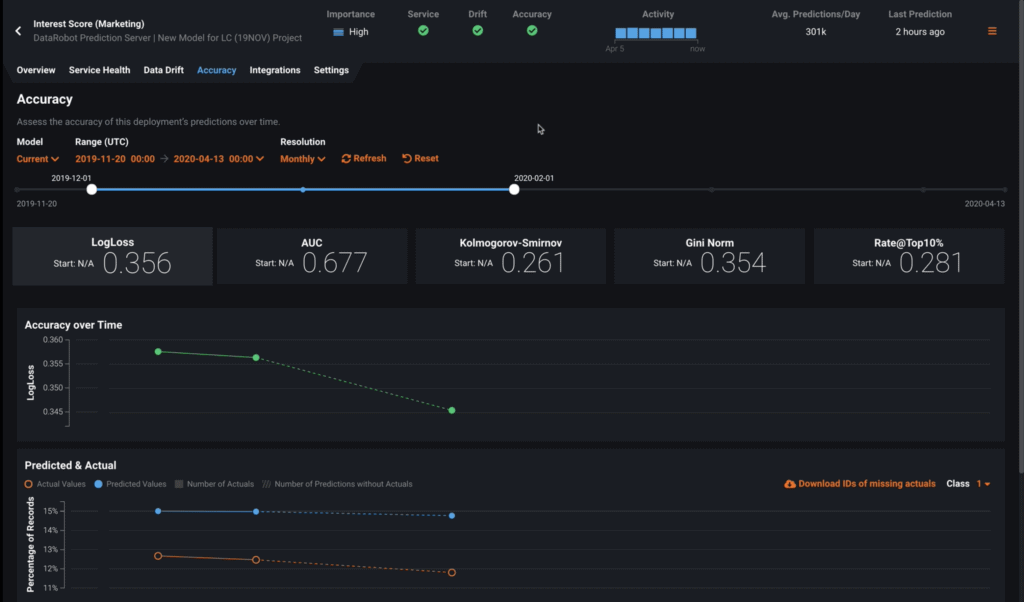
The Accuracy page will show you how accurate the predictions are for the model. This requires you to upload the actual results for the predictions the model made. Again, the date range slider in the first section works the same as on the Service Health and Data Drift pages. The accuracy data below displays slightly different results based on whether the deployment data is from a regression or binary classification model.
- The Accuracy Over Time plot shows the change in a selected accuracy metric over time, which in this case is LogLoss by default. You can click on any metric tile above the graph to change the display for that metric. Hover over any point on the graph to see specific details.
- The Predicted & Actual graph shows the predicted and actual values plotted together along the timeline highlighting where they differ. Hovering over a point in either plot shows the same values as those on the Data Drift page. The volume chart below the graph displays the number of actual values that correspond to the predictions made at each point. The shaded area represents the number of uploaded actuals, and the striped area represents the number of predictions missing corresponding actuals.
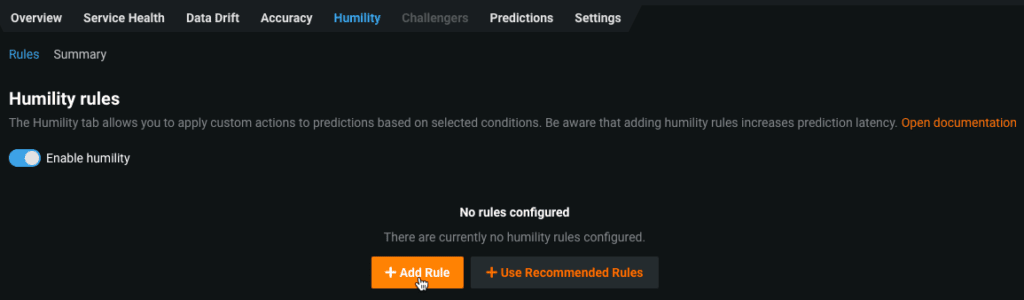
The Humility tab allows you to create rules that are automatically applied when the input prediction made is uncertain or the input prediction data contains values that are either not seen before or are outside of an expected range. Once a rule is satisfied, it triggers the corresponding action.
To create a Humility rule, first toggle the button to enable it.
Then create a new rule by selecting Add Rule. Each rule applied to the deployment’s predicted values is composed of two components: a trigger that detects a rule violation and an action to apply to the violating prediction.
Select the trigger condition from one of 3 options to identify if prediction or feature values violate the rule:
- Uncertain Prediction—detects whether a prediction’s value violates the configured thresholds, for which you set the lower-bound and upper-bound thresholds.
- Outlying Input—detects if the input value of a numeric feature is outside of the configured thresholds.
- Low Observation Region—detects if the input value of a categorical feature value is not included in the list of specified values.
Then select an action for DataRobot to apply if a trigger indicates a rule violation. There are three actions available:
- No Operation—no changes are made to the detected prediction value.
- Override prediction—predicted values for rows violating the trigger are modifed with the value configured by the action.
- Throw error—rows in violation of the trigger return a 480 HTTP error with the predictions, which also contributes to the data error rate on the Service Health tab.
Alternatively, you can opt to use the rules provided recommended by DataRobot (select Use Recommended Rules rather than Add Rule). This option generates two automatically configured humility rules:
- The Uncertain Prediction trigger with the No operation action
- The Outlying Input trigger for the most important numeric feature, which is based on Feature Impact results, and the No operation action.
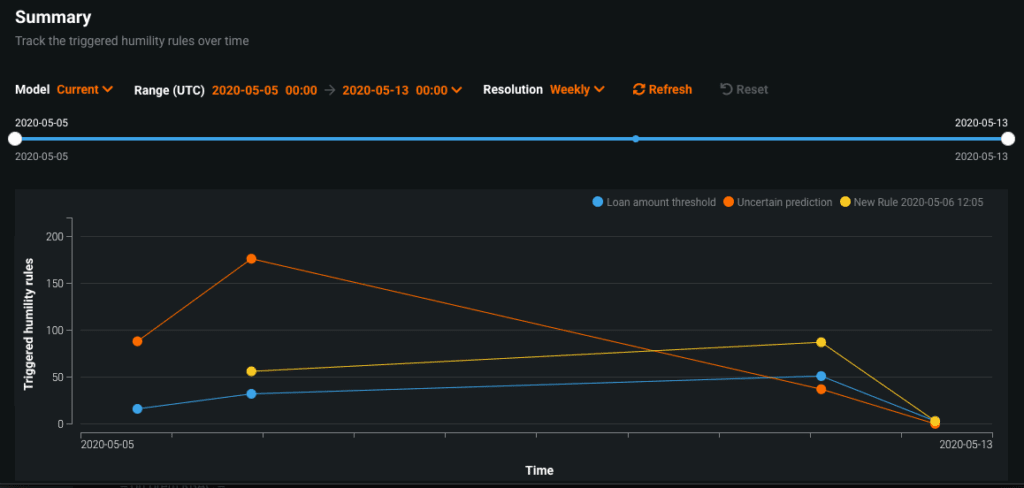
Like Service Health, Data Drift, and Accuracy, the timeline allows you to view how often rules are triggered over a specified period of time.
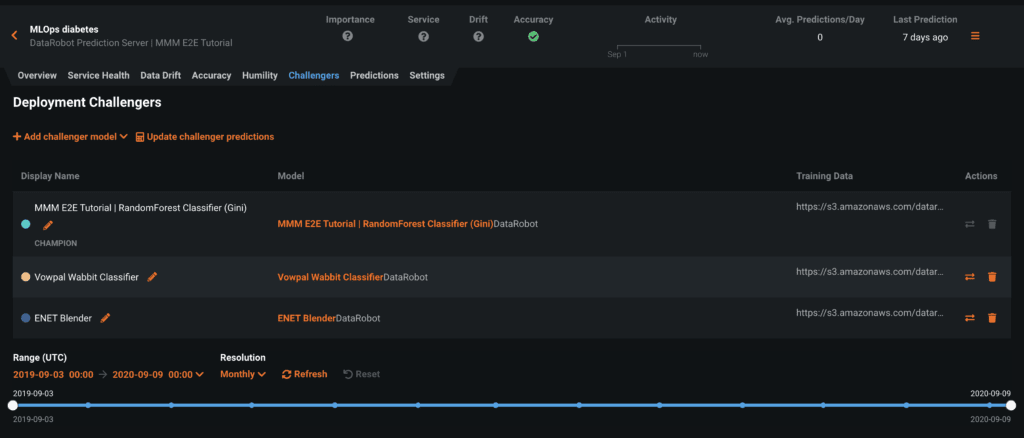
The Challengers tab allows you to compare multiple alternative models to the model currently deployed. You can submit challenger models that shadow a deployed model and replay predictions made against the deployed model to see how it compares. If the alternative performs better, you may want to replace it.
Before adding a challenger model to a deployment, you must first build and select the model to be added as a challenger from the leaderboard of an existing project. Then click Add Challenger Model which prompts you to select a model package from the registry to serve as a challenger model. DataRobot will verify that the model shares features and a target type with the champion model.
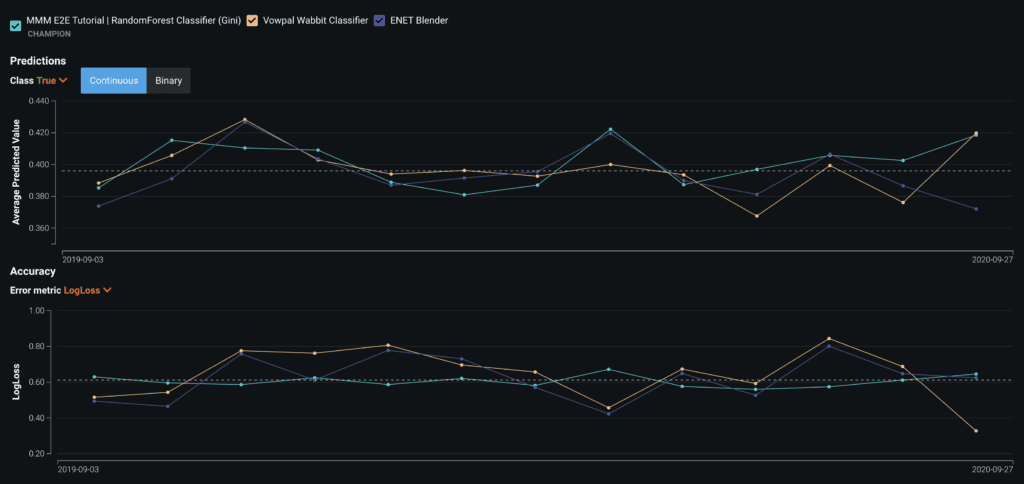
You can then replay stored predictions made with the champion model for all the challenger models added. This allows you to compare performance metrics such as predicted values, accuracy, and data errors across each model. To replay predictions, select Update challenger predictions.
Under Predictions, you’ll see several different ways to get predictions out of DataRobot.
- Use the Make Predictions interface to easily drag and drop scoring data and return prediction results.
- Integrations enable connections with a variety of enterprise databases. You select a data source to make predictions, define a schedule on which data is scored, and receive the results of predictions—all from a DataRobot deployment.
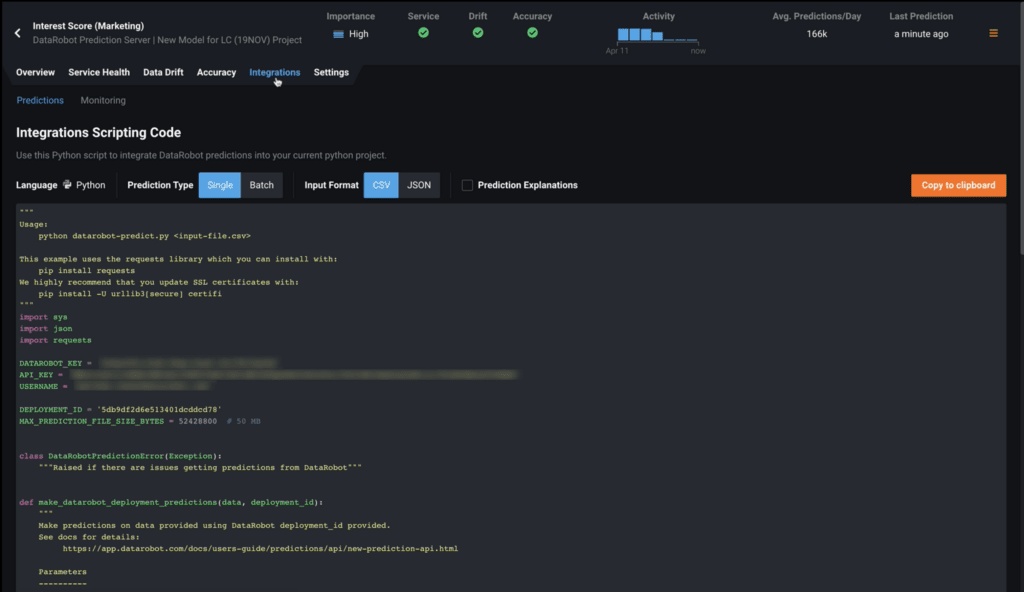
- Prediction API provides a sample in the Python language of the necessary lines of code needed to make an API call to DataRobot to score new data. In many cases, you can simply copy and paste this into your software program and in a matter of minutes you’re integrated and up and running with DataRobot and our API.
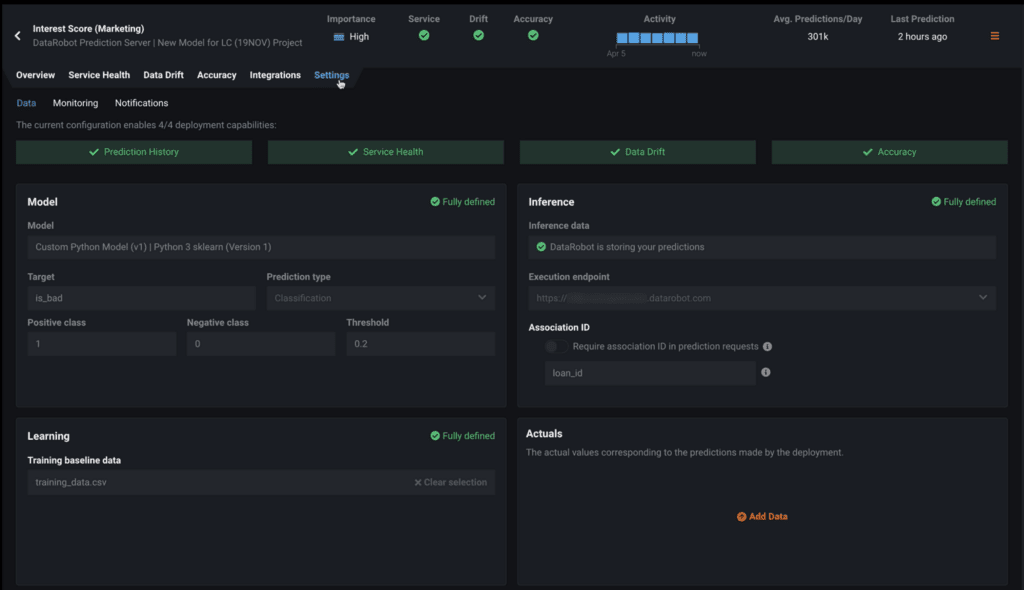
And lastly, Settings provides an interface to upload and configure datasets associated with the deployment and underlying model. Namely, this allows you to add data to a deployment, set up notification settings to monitor deployments with alerts, and enable prediction warnings.
- The Data tab allows you to upload Learning, Inference, and Actuals datasets to your deployment that you may not have initially provided when creating a deployment. This data is required to track data drift and accuracy.
- Learning data is the data you trained your model with, which acts as a baseline.
- Inference tells DataRobot you want to store the predictions you make, along with an association ID that is used to link predictions made to the actual results so you’re able to track accuracy.
- And the Actuals section allows you to upload those actual results
- From the Monitoring tab, you can schedule the frequency that Service Health, Data Drift, and Accuracy email notifications are sent for the deployment.
- And you can set the types of notifications you want to receive from the Notifications tab. The delivery schedule is managed via the Monitoring tab and can be set by deployment owners.
- The Challengers tab allows you to set up a schedule to automatically run stored predictions on challenger models.
More Information
Find out more about DataRobot’s deployment capabilities by visiting our public documentation portal and navigating to the Deployment section.

-
How to Choose the Right LLM for Your Use Case
April 18, 2024· 7 min read -
Belong @ DataRobot: Celebrating 2024 Women’s History Month with DataRobot AI Legends
March 28, 2024· 6 min read -
Choosing the Right Vector Embedding Model for Your Generative AI Use Case
March 7, 2024· 8 min read
Latest posts
